
The key to any successful product, particularly a mobile game, is for your CPI (cost per install) to be less than your LTV (lifetime value of a customer). As long as it costs less to acquire a new customer than they are worth, you have a healthy business. Once the cost of acquiring a new customer exceeds the value of that customer, your product or company will languish and eventually die.
The challenge of computing LTV
While virtually nobody would argue the logic behind using LTV to drive your marketing, implementing it is not always easy. Many companies do not have a reliable LTV formula for all of their products or a data scientist (or team) to create one. New products also do not have enough data to calculate LTV.
Even when you have a reliable LTV calculation for your product, every cohort of user will have a different LTV. Players acquired one month will not have the same LTV as those acquired a different month. Players acquired through one marketing channel will not have the same LTV as players acquired through a different channel. Same can be said for country, marketing creative, platform and many other factors.
You will also not have enough data early in a campaign to calculate LTV reliably. However, you do not want to spend on unprofitable campaigns and you want to support good campaigns with more resources.
The answer to measuring campaigns reliably
The best proxy for understanding if your CPI is below your LTV is ROAS (return on ad spend). ROAS measures how much revenue a certain cohort of users generates over the first X days of acquiring those players (with X normally measured after 3, 7 and 30 days).
While it sounds overly simplistic, short term ROAS tracks very closely with your long-term return, thus whether CPI < LTV. You can be very certain if your 30 day ROAS is performing ahead of target, your acquisition is profitable. Moreover, I have found that even 3 day ROAS is very indicative of long term profitably. I have not yet come across a situation where ROAS has indicated a campaign is profitable for it to falter when analyzed after months or years. I am now very comfortable relying on 3 day and 7 day ROAS metrics to decide whether to continue, increase or decrease spend for a product, specific vendor or campaign.
Benchmarks to target
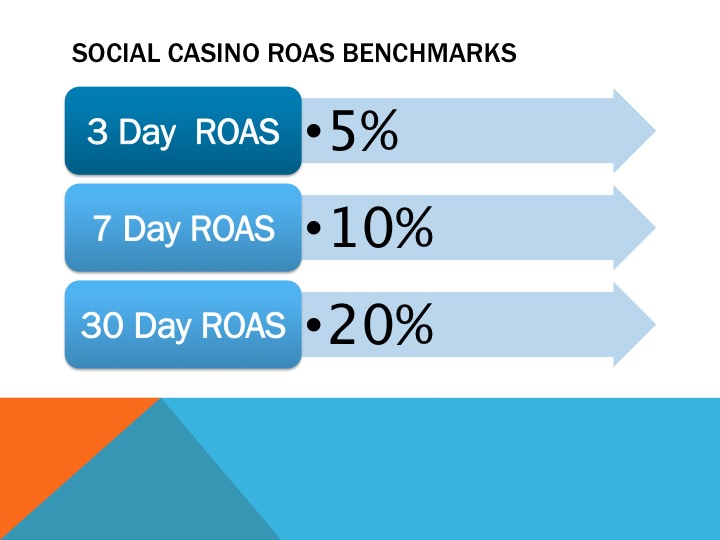
Without benchmarks, ROAS numbers would be useless. You need to know what numbers to target. As I have been in the social casino space for about five years, I am only comfortable providing social casino benchmarks. When evaluating a product or campaign, I target a 3 day ROAS of 5 percent, 7 day ROAS of 10 percent and 30 day ROAS of 20 percent. For other genres, such as hyper-casual (where you generate most of your return early), your targets would be very different so understand your space before making decisions (actually before launching a product).
What to do if you are missing your benchmarks
As with all metrics, ROAS provides guidance, not black and white answers. If your ROAS is slightly below the benchmarks, you may not have a problem, it could be noise. If one agency is outperforming another by 1 or 2 percent, again it may not be indicative, it may be luck (one caught an extra VIP). Conversely, if you are missing even by a little, it could be indicative of a deeper issue. A small miss also means that you should adjust conservatively until you see your 30 day ROAS numbers.
If performance is significantly behind ROAS benchmarks, then you need to find the cause. If it is across the board (all campaigns), then your product has issues. You either need to address these issues and improve retention or monetization (the key drivers of LTV and return) or not invest in the product. If the performance is worse on a particular platform, you need to dive deeper into your technical performance on that platform versus other platforms and how the user experience (CX) differs on the underperforming platform. If the underperformance is with a partner or channel, you should adjust your spend to focus where you have a stronger ROAS.
Key takeaways
- While the success of any product or company long term is ensuring its cost for acquiring a customer is lower than the value of the customer, it is difficult to calculate in the early days of a product or marketing campaign. ROAS (return on ad spend) based on the first 3, 7 or 30 days of a campaign provides a good proxy for whether the campaign is successful.
- In the social casino space (other genres may be different), the benchmark target ROAS is a 3 day ROAS of 5 percent, a 7 day ROAS of 10 percent and a 30-day ROAS of 20 percent.
- If your ROAS is underperforming significantly, you need to evaluate if you should continue investing in the product overall or in the specific marketing channels, while adjusting your marketing mix to optimize ROAS.

Hey Lloyd – thanks for sharing. Are you adding organic installs rev into the ROI calc?
LikeLike
Actually a great question. The short answer is no, you should not include organics. The long answer is some companies do and there are legitimate reasons, if you are comfortable with a longer payback period (necessary for some genres) or your game is particularly viral. The main problem I have with including organics is that they normally are not generated at the exact same time the paid ads are running. If you spend $1 million in January, that will generate organics in Feb and Mar. It’s very hard to attribute the organics to the right cohort. It is impossible once you are looking at ROAS by channel or source.
LikeLike