One of the biggest challenges game and iGaming companies face is measuring the impact of sales but a presentation by Google’s Adam Carpenter shows effective analytic tools for optimizing your promotional strategy. Most social game companies regularly run offers, from 20 percent off to double your chips to free tournament tickets with purchases; and these offers increase revenue immediately.
The problem is that it is very challenging to measure the overall and long-term impact of the sales. While it may have tripled revenue the three days the sale ran, how much did it depress revenue the following days or weeks (or preceding days/week if people waited for the sale). Many very smart analysts and product managers believe that sales and promotions create zero additional revenue, it only shifts revenue between periods (which is great if you are trying to hit a quarterly goal, not as good if you are trying to grow a product). Analysis of before and after the promotion or estimates of hangover are somewhat arbitrary and self-serving (when do you start, when do you end, what baseline do you take, etc.).
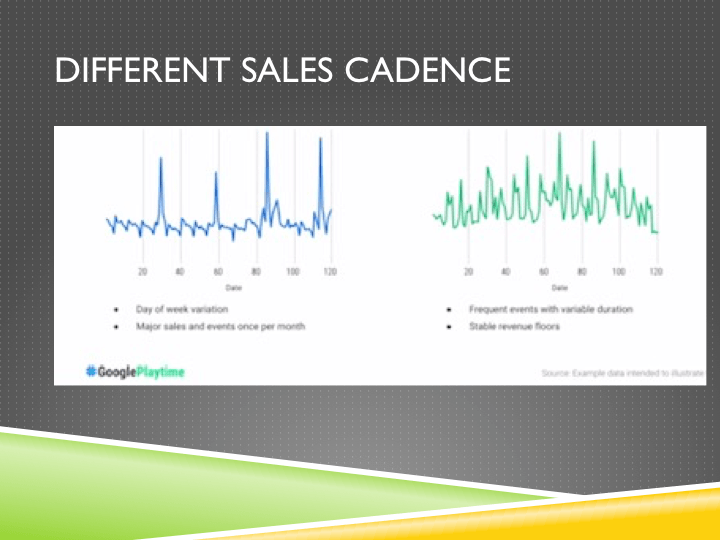
It is also important to understand what sales frequency is most beneficial Every game is different and some games generate the most absolute revenue from running frequent sales while others do best running a few large sales. It depends on your target customer, their expectations, competitive products, the game mechanics, frequency of content releases, etc. Just looking at revenue generated from the sales, however, makes it very challenging to understand how the type of sales are driving performance. The graph below, comparing regular sales to running big sale events, is difficult to interpret and could easily be misinterpreted:
The lack of a good technique for measuring the impact of sales has far-reaching implications. Companies do not know if they should run sales, how frequently to run them and the best offers to make. Getting it wrong not only could shift revenue but it may significantly depress it if players are waiting for sales and do not monetize. A mistake can also lead to a misallocation of resources, are the two product managers planning sales more valuable creating events or new features?
Monetization Tree
Prior to being able to analyze promotions, Carpenter suggests you understand how your game generates revenue. He does this with the revenue tree, which shows how daily revenue is driven by DAU (daily average users) and average revenue per daily unique (ARPDAU):
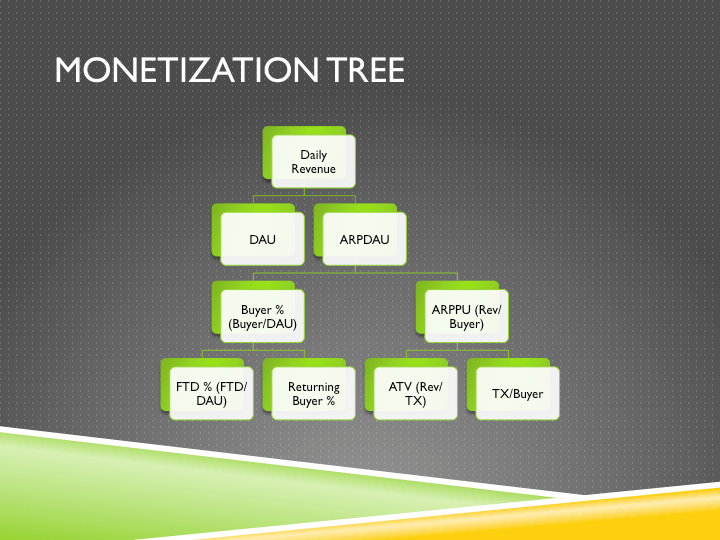
When Carpenter breaks down the drivers of ARPDAU, he points out that focusing on buyer percentage creates a healthier product than those that generate most of their revenue from big purchases (a high ARPPU) from a few players. He also points out it is much easier to increase ARPPU because those players have already chosen to pay but long-term your game will be safer and grow better by impacting buyer percentage.
Revenue heartbeat
After initially watching Carpenter’s presentation, we implemented the revenue heartbeat and I found it provides great insights into the effectiveness of your sale calendar. It allows you to visualize how sales are working over time.
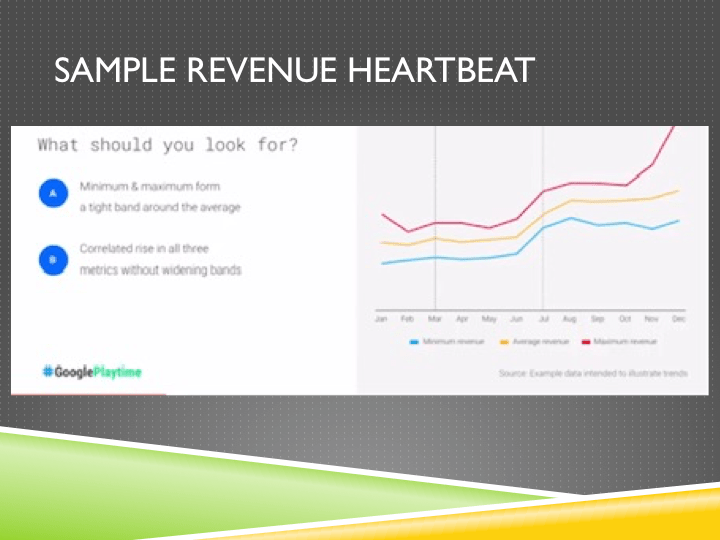
To create a revenue heartbeat, for any given month, calculate the minimum revenue day, the maximum revenue day and the average revenue for the month. Below is a sample revenue heartbeat from Carpenter’s deck:

Your game has a healthy heartbeat if there is a tight band around the average daily revenue. You do not want to see wild variations on a monthly basis, instead you want to see that min and max form a tight band around the average. No wild variations on a month to month basis and that average revenue is growing, showing the game is growing healthily and players are engaged. The image below shows a healthy revenue heartbeat, despite the boost due to a Black Friday sale:
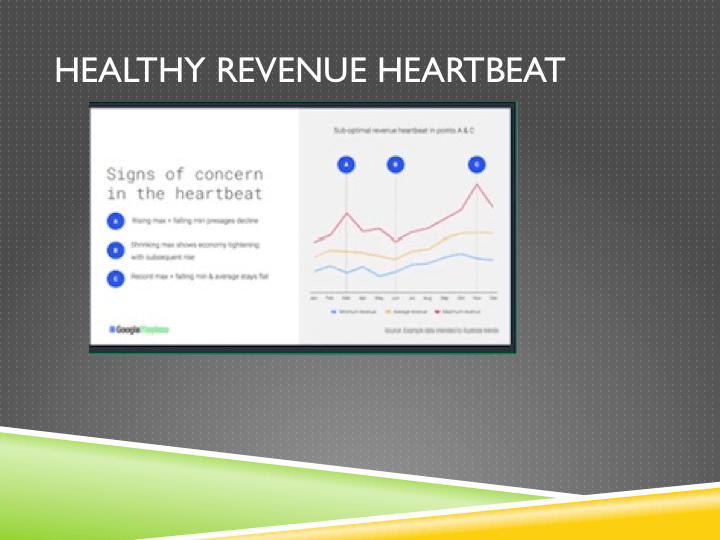
Conversely, if average revenue is regularly decreasing and you see multiple months with big gaps between average revenue and min/max, then you should be concerned. Products rarely grow when there is a negative heartbeat, below is an example from Carpenter:
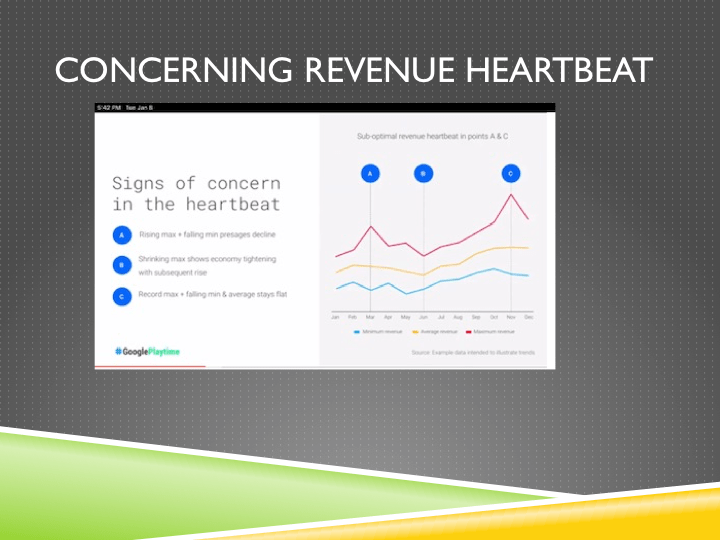
When using the revenue heartbeat, do not focus on the average revenue but instead the spread between average and min/max and how it changes over time. Average revenue is also dependent on DAU (see revenue tree) and steady growth in average revenue could be due to marketing spend while masking a sick product.
Coefficient of Variation (CoV)
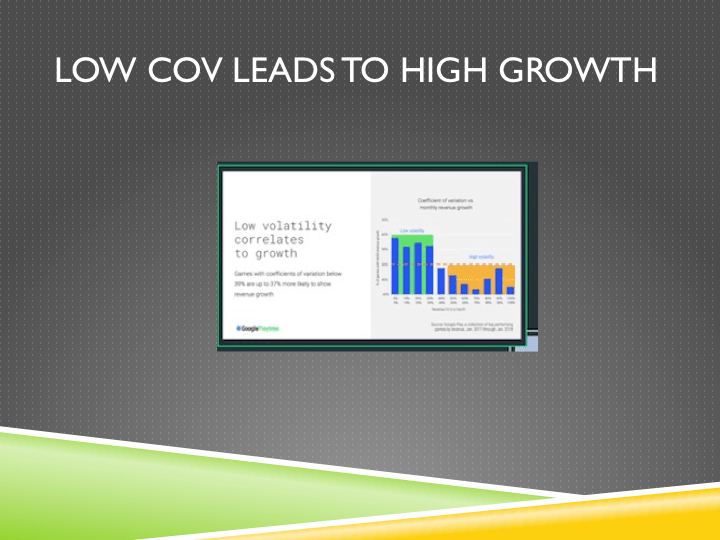
The coefficient of variation (CoV) complements the monetization heartbeat in helping understand if your promotional and sale behavior is optimal. Carpenter points out that CoV correlates highly with revenue growth, a low CoV means your game is much more likely to see strong growth. Games with the lowest CoV have highest month over month growth, games with high volatility experience much less growth.

It is a great KPI to understand the effectiveness of your sales and whether you are running them too frequently. To calculate the CoV, you take the monthly standard deviation of daily revenue and divide it by the mean revenue.
The chart below shows you want to have a CoV between 10-39 percent, as that is where the majority of fast growing games fall:
If you are experiencing a high CoV, you should work on finding alternatives to large sales. Some options you can try include:
- Increasing the frequency but lowering the value of the promotion, many small sales.
- Tie sales to the release of new content, so there is a drain on resources
- Become predictably unpredictable, have players expect something good every time they play but not know what to expect
- Run demand events targeted to increase player engagement
- Release time limited content
- Use elite gatcha crates/offers
Understanding sales performance allows for optimization
By tracking your revenue heartbeat and Coefficient of Variation, you can understand how sales are impacting your performance. Given that growth is tied to low volatility, it helps you identify whether you should adjust your sales and promotion strategy. These tools also allow you to track your game over time; so even if the strategy does not change you will see if players start adapting their behavior, thus requiring a change in your strategy. While these metrics were built for mobile games, they actually can apply to any product or business, even retail.
Key Takeaways
- Understanding how sales and promotions are impacting your game is critical to growing revenue.
- The revenue heartbeat visually shows how well revenue is tracking with your big sales, you want to see a small gap between the three lines. To create a revenue heartbeat, for any given month, calculate the minimum revenue day, the maximum revenue day and the average revenue for the month.
- The coefficient of variation (CoV) shows how volatile your revenue is and a low CoV is correlated with growth. To calculate the CoV take the monthly standard deviation of daily revenue and divide it by the mean revenue.
