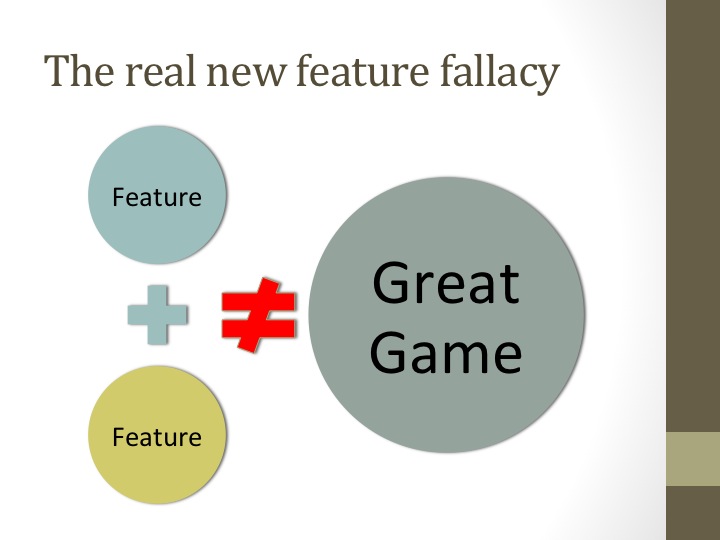
From the beginning of time (or at least 2009), companies have been basing decisions on game metrics, investors have used performance metrics to base investment decisions and outside analysts have used game metrics to estimate the health of a company. Unfortunately, all of these applications of metrics are deeply flawed and often mislead the decision-makers, investors and analysts (sometimes intentionally, sometimes not).
The charts below from Appsflyer show the critical flaw in looking at a game’s metrics:
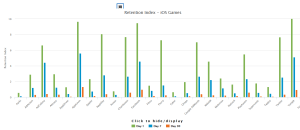
Retention performance on Android by source:

It all depends on the source
The first lesson from these charts is that performance depends largely on the source of users. Although these charts show retention metrics, I am certain monetization and virality performance shows similar behavior. Thus, your performance metrics are incredibly biased by the source of traffic and metrics for your game overall only reflect the quality of the various user sources.
As an example, assume your Bingo game has D7 (Day 7) retention of 20% and an ARPDAU (average revenue per daily active user) of $0.25. Your main competitor’s game had D7 retention of 10% and an ARPDAU of $0.15. Based on this information, you may decide to cancel other projects and focus on this game. As a corporate development expert, you may aggressively try to acquire this company. The problem, however, is that the competitive game may be three years old and the company is using a very weak user acquisition channel that does not have a high cost because they have gotten all potential users from the better channels. Conversely, you may have acquired users through a Facebook mobile ad campaign targeting high-value Bingo players. Thus, your new users are of much higher quality than those from competitive Bingo game.
Even if your game is significantly worse, its metrics would look better at this stage. If you decide to focus on this game, the new users you bring in end up performing much worse than when you made the decision. This deterioration is not due to the game getting worse; it’s just based on a different set of users. If you end up acquiring the company for $100 million, you will then find out that as you try to grow it, you have trouble getting new profitable users.
Trends can be misleading
Trends one of are the most powerful analytics tools in your arsenal, as they show how your product or game is performing over time and if it is improving or deteriorating. Looking at the Appsflyer charts, however, it’s easy to see that that trends can largely be created by changes in the user mix. As the user acquisition team changes the mix of players, the new mix could create upward trends even if the game has not improved or deteriorated. The changes in behavior will be caused by the changes in user mix.
The only metric that counts
I have written many times about customer lifetime value (LTV), and the variance in metrics by source shows the central importance of focusing on the lifetime value to CPI (cost-per-install) equation. To summarize, LTV is how much profit a new player will generate for you in total and is a function of retention, monetization and virality. As long as your LTV is higher than the cost of acquiring that customer (CPI for paid user acquisition on mobile or web), you want to continue acquiring players.
Given the variance in performance by source that the AppsFlyer charts show, the LTV by source will also have huge variance. Thus, the goal is to have an LTV higher than the cost of user for that source. The LTV on a global scale is not important, it is finding pockets where LTV is greater than CPI and then acquiring against those targets. Any target KPIs (key performance indicators) outside of LTV being greater than CPI are worthless because this last equation will determine the success of your game. Anything else can be manipulated (e.g., buying users from certain sources who generate your “goals”). As long as LTV exceeds CPI for a source, you can acquire users from that source and grow your game. Once there are no sources where the LTV for that source are higher than the CPI (even if overall LTV is higher than many sources but not higher by source), you cannot buy users and the game will stop growing and start withering.
What it means
The high variance in performance of players by source has several important implications:
- You must track performance of users on a cohort/source basis. Only by comparing similar users can you understand how your game is performing.
- The sophistication of your user acquisition/growth team is critical. Managing CPIs is meaningless if it is not tied to the performance of the users; you need growth experts who can get you users with the highest yield (delta between LTV and CPI). You also may otherwise miss opportunities where your metrics may not appear to support buying expensive traffic, but that traffic will perform so well that it is a good value.
- Holistic game metrics (sometimes referred to as vanity metrics) are meaningless or even misleading. You need to focus on keeping LTV higher than CPI for your sources of traffic.
The critical point is not to focus on vanity metrics that can be manipulated and are not actionable. Instead, focus on the performance of your product for specific cohorts of customers.
Key takeaways
- There is an extremely high variance in performance of users based on the source of the users. Thus, it is misleading to look at overall metrics as they are largely a result of your user sources.
- You must track performance of users on a cohort/source basis. Only by comparing similar users can you understand how your game is performing.
- It is critical to build a strong growth or user acquisition team. Managing CPIs is meaningless if it is not tied to the performance of the users, you need growth experts who can get you users with the highest yield (delta between LTV and CPI).