Skip to content Skip to navigation

The Business of Social Games and Casino

How to succeed in the mobile game space by Lloyd Melnick

analytics

Customer analytics tips for gaming companies

by Lloyd MelnickJuly 15, 2020June 27, 2020

While social and mobile gaming companies are generally at the cutting edge of applying analytics, I recently took an online course from Wharton on Coursera that provided some additional insights in how to best use analytics in online gaming. These takeaways range from ways to improve your UI to how to calculate LTV more accurately.

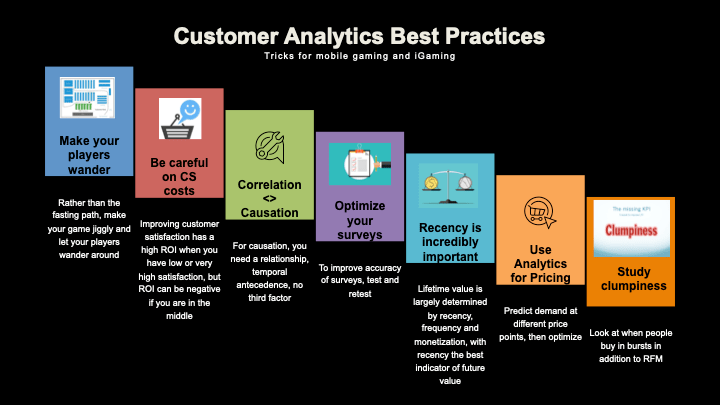
Make your players wander

One of the most interesting takeaways from the course is that efficiency is not always the desired player behavior in the online world. In traditional retail, retailers found they enjoy much higher revenue when customers wander around the store rather than quickly find what they have come for. In the studies cited, about 75 percent of movement inside a store is not required. Sixty percent of purchases are items people had no intention of buying when they went into the store. Instead retailers optimize for “jiggliness,” as people with the most jiggliness buy the most.

jiggliness

There are uses of this concept for online gaming and iGaming companies. Rather than optimize your lobby and UI (user interface) to ensure your players find what they are looking for, take them on a journey around your game. If it is a social casino, rather than finding the slot they know and love, expose them to some other content, they may find something they prefer.

Higher customer satisfaction may not improve profitability

While customer satisfaction is positively correlated with profitability, the relationship is not linear. Companies with a low level of customer satisfaction, referred to as the Zone of Pain, experience a strong impact on revenue when making improvements. That is, the firms with awful customer service see big benefits just moving out of the Zone of Pain.

On the high end, companies that provide great customer service and differentiate themselves with it experience positive ROI by making the experience even better. These companies are what is referred to as in the Zone of Delight. Retailers like Nordstroms, which enjoy high margins due to their customer service, see a huge impact when they find even better ways to provide a WOW experience.

nordstrom

When customer satisfaction is only a small part of a company’s value proposition, improvements do not necessarily have a positive return. There is a large flat region where increasing satisfaction does not increase profitability. The key takeaway is that the relationship between customer satisfaction and profitability is not linear, but starts with a Zone of Pain, then hits a sizeable flat region, and then moves to a Zone of Delight.

Correlation does not equal causation

We should all know by now that just because two variables have related movement, you cannot assume one is causing the other. I see this mistake made frequently, including by BI experts. Correlation only shows a relationship between two variables. Causation, more critically, shows that one variable produces an effect on the other variable. It is crucial to remember there are three requirements for causality:

  1. Correlation
  2. Temporal Antecedence. X must happen before Y.
  3. No third factor is driving both. Need to control for other possible factors.

Use analytics for pricing

I am surprised at how often pricing strategy in mobile games (the cost of in-app purchases) or in iGaming (RTP and bet levels) is driven by competitive analysis and intuition rather than analytics. Regression, however, can be used to set optimal pricing (including for virtual goods) at the level that boosts profits. Regression can predict demand at prices that have not been tried, thus you can determine profitability for different options. As predictions can be completed for different future prices, you can then determine optimal price. Effectively, you answer the question what you can charge to make the maximum profit (and with virtually zero marginal cost for online products, can be simplified to maximum revenue).

Preparing better surveys

While market research is a less than reliable way to understand customer intent, it still provides valuable insights into your players. Surveys are a good way to learn about potential customers and are relatively low cost. Some best practices include:

    • To improve reliability of surveys, test and then retest. If the results are consistent, it shows you are getting reliable results (people still may not know what they want though).
    • There are multiple ways to ask questions in a survey (comparative, rank, paired comparison, Likert, continuous, etc.) and you should understand your end goal when deciding which format to use. Advantages of open-ended questions allow for a general reaction that can help interpret closed end questions and may suggest follow up questions. Closed end requires a lot of pre-testing but is easier to administer.
    • Focus on drafting high quality questions. Use simple, conventional language and avoid ambiguity. Do not ask any questions more than 20 words. Most importantly, avoid leading and loaded questions (i.e. How bad a job is Lloyd doing?).
    • Pay attention to sequence and layout. Start with an easy and non-threatening question. Have a smooth and logical flow. Have the questions go from general to specific. Keep the sensitive or difficult question at the end.
    • The key to using surveys effectively is validity, how well it predicts variables you are interested in. If you find surveys effectively predict certain behavior, then they are an appropriate tool for predicting that variable.
    • Make sure your results are generalizable to an appropriate population. You need to define clearly the population, choose a representative sample, select respondents will to be interviewed and motivate them to provide information.
    • Pre-test your survey. Ensure respondents understand each question and the questions make sense.
    • Collect data on non-respondents as they may be systemically different. Try to convert them to responding.

Recency is incredibly important

When looking at the future value of a customer, the three keys are how recently they made a purchase (recency), how many purchases they have made (frequency) and monetization (size of the purchase) recency is by far the best predictor of future value. Frequency is then significantly more indicative than monetization. Thus, focusing on increasing the size of a purchase (up-selling) is the least valuable strategy you can pursue to increase your customer’s lifetime value.

Include clumpiness in your LTV analysis

I wrote several weeks ago about the important of clumpiness in determining a customer’s future value so will not go into too much detail again. Clumpiness refers to the fact that people buy in bursts and that those customers could be extremely valuable. When calculating customer value and segmentation, we focus on analysing recency, frequency and monetization of the customer, as I discussed above. This analysis is based on customers making purchases in a regular pattern, i.e. coffee, diapers or milk. For certain products (and I would classify social and casino games here), customers actually monetize in bursts. Thus, you need to add C for clumpiness to your modeling.

Key takeaways

  • People who wander around a retail location spend more than ones who immediately find what they are looking for and retailers optimize to create this jiggliness. Online casinos and games can also build in jiggliness so players find new games and offerings rather than simply quickly go to the one they are looking to play.
  • While satisfaction with customer service positively impacts profitability, the relationship is not linear. Improvements have a strong impact when players are highly dissatisfied (and that is corrected) or when customers with great service make further improvements, companies in the middle often do not see a positive ROI on CS improvements.
  • A relationship between two variables does not show one is causing the other, to have causation there must be a relationship plus temporal antecedence plus the absence of a third variable driving both factors.

Slide1

Share this:

  • Facebook
  • LinkedIn

Like this:

Like Loading...
Analytics General Social Games Business General Tech Businessanalytics Clumpiness customer service Jiggliness pricing recency survey
3 Comments

The subscription KPIs that matter

by Lloyd MelnickJanuary 21, 2020March 13, 2021

I have written several times recently about building and running a successful subscription modelin gaming but I did not address how to measure whether it is successful. To grow any business you need to understand what to measure so you can then optimize against these KPIs. While subscriptions do share some common characteristics with the free-to-play business, driven by the in-app purchase model, there are certain KPIs unique to subscriptions that you should focus on when building your program. As Leandro Faria says in The Essential SaaS Metrics Guide, “data doesn’t do you any good unless you act on it.”

MRR

Monthly recurring revenue (MRR) is generally the first KPI that companies focus on when looking at the health of their subscription program. You calculate MRR by looking at the average revenue per subscriber by the number of subscribers. If you only have one subscription level, then it is simply the monthly subscription cost times the number of subscribers. If you have subscriptions for various terms (monthly, quarterly and annual, for example), you calculate the average monthly revenue from the different subscription (an annual subscription of $144 generates $12 per subscriber in MRR). The formula is

  • MRR = Average monthly revenue per subscriber (ARPS) * Total number of subscribers

The reason MRR is the first KPI that subscription businesses monitor is because it shows the value of the model. MRR effectively is how much revenue the business can count on every month. The company can then allocate this cash flow to marketing, operations, acquisitions, etc. By having a guaranteed amount of revenue (which you do not have with discrete sales or in-app purchases), you have a clear source of funds to operate your business. Most companies will extend MRR to create an Annual Run Rate (ARR), which is important both for business planning purposes and understanding the value of the subscription component of your business.

MRR Growth

In addition to looking at MRR, you should monitor MRR Growth. To analyze MRR growth, you need to break it into three components. The first is new MRR, revenue brought by newly acquired customers.

The second component of MRR growth is Expansion MRR. Expansion MRR is increases in subscription revenue from existing subscribers. This revenue is driven by up-selling and cross-selling your customers.

The third element of MRR Growth is churn. Churned MRR is the revenue that has been lost from customers cancelling or downgrading their plans.

Taking these three components into account, the overall formula for MRR Growth is:

  • MMR Growth = New MRR + Expansion MRR-Churned MRR

CURR

I have written before about CURR (current user return rate), and it is as valuable in subscription businesses as it is for other online models. CURR shows how loyal your existing customers are; you should consider CURR the inverse of churn. If your CURR increases, it means you have improved your product’s appeal to existing players or customers, if CURR declines you have made your game worse. CURR is also an excellent way of looking at how your game is performing among different segments, VIPs versus payers versus never-spenders.
To calculate CURR:

  • Subscribers who were active between t-14 (14 days before today, today minus 14) and t-20 and who used the product between t-7 and t-13, what percentage returned between t-0 and t-6.

Measuring CURR is critical to see how engaged your subscribers are. If CURR trends downward, you are likely to experience increasing customer churn.

.

ARPS

As mentioned above, Average Revenue Per Subscriber (ARPS) is central for calculating MRR, but it is also an important KPI itself. Increasing ARPS shows that customers are upgrading and most likely seeing high value in your offering, thus they are willing to pay more. Conversely, declining ARPS shows that customers are not experiencing sufficient value and are either down-grading or moving to free plans

You should also monitor ARPS separately for existing players versus new players. As Faria writes, “there is a good practice of measuring the Average Revenue per [subscriber] separately for new customers. So instead of having an [ARPS] metric for all your customers, you’d have two different metrics: Average Revenue per Existing [Subscriber] and Average Revenue per New [Subscriber].” To calculate:

  • ARPS [existing] = Revenue from existing subscribers / # of existing subscribers
  • ARPS [new] = Revenue from new subscribers / # of new subscribers

Churn

Churn is the enemy of any business, but is even more troubling for subscription businesses. You never want to lose customers, but with subscription businesses churn means you are losing not simply a sale but an entire revenue stream.

You need to monitor both Customer Churn and Revenue Churn.
Customer Churn is how many players have canceled their subscription while Revenue Churn is how much those lost customers represents in revenue. There are thus three churn KPIs you should closely monitor:

  1. Churn = # of Churned Customer / Last Month # of Customers
  2. MRR Churn = SUM (MRR of Churned Customer)
  3. MRR Churn % = Churned MRR / Last Month’s Ending MRR Negative

CAC

Customer Acquisition Cost (CAC) is the cost to acquire an additional customer, your marketing cost per customer. One way to calculate CAC is to consider the three variables that compose it. This method allows you to go into detail and might give you good insights about your sales process cost and conversions:

  • CAC = (CPL (cost per lead or cost per install) + Touch cost per customer (cost of your marketing team and any consultants)

I prefer to focus on cost per install (CPI) or cost per subscriber (CPS). As long as your lifetime value is higher than your CPS, you can continue to acquire subscribers and manage your overhead, including your marketing infrastructure.

LTV

Speaking of customer Lifetime Value (LTV), I have written repeatedly how it is the lifeblood of a successful business. LTV is a function that shows the present value of a new customer, how much that customer is worth to your company. While the equation is effectively the same for any business (the total expected value of your customer over their lifetime), it is somewhat simpler to calculate for subscription businesses. To calculate LTV for a subscription business, the following formula captures the core elements:

  • LTV = ARPS * % Gross Margin / % MRR Churn Rate

The hybrid model

While these KPIs show the health of a subscription business, you need to modify how you use them in most social games as well as iGaming. As subscriptions will only be one element of your revenue stream, in-app purchases will remain a major part of social gaming while gambling revenue will drive the casino industry. The above KPIs will help understand the health of the subscription element of your business, and whether you should invest in growing it, but they need to be incorporated into your other KPIs to understand both the impact on your business and your overall financial health. Subscription revenue will only be one part of your overall LTV calculation while you may want to look separately at CURR of players customers versus those making in-app purchases. There are many different combinations of models but the core subscription KPIs need to be incorporating into your daily review of the health of your business.

Slide1.png

Key takeaways

  • To run a successful business, you have to constantly monitor KPIs and optimize based on this data; the subscription model is no different but the KPIs are not the same as the ones you are used to reviewing
  • MRR (monthly recurring revenue) is the most important KPI for the subscription model, how much subscription revenue you generate (and can count on) each month.
  • Other critical metrics for the subscription model are MRR growth average revenue per subscriber (ARPS), current user return rate (CURR), cost to acquire a customer (CAC), customer lifetime value (LTV) and churn.

Share this:

  • Facebook
  • LinkedIn

Like this:

Like Loading...
Analytics General Social Games Business General Tech Business Social Games Marketinganalytics kpis Subscriptions
1 Comment

An often-better alternative to AB testing?

by Lloyd MelnickNovember 19, 2019November 18, 2019

While AB testing is an integral element of mobile and social game development (as well development of most digital products), in many situations there is a better option. Several years ago, I had the opportunity to serve as an advisor to a company that had some brilliant people. Their CTO was a strong advocate of using multi-armed bandit testing as a superior alternative to AB testing. Multi-armed bandit testing is not new, there was a popular post in 2012 (http://stevehanov.ca/blog/index.php?id=132), and it is used by Google and other tech giants, but people (especially product managers) still regularly default to traditional ABn testing.

The problem with AB testing is that you leave money and performance on the table. Until the test is over, the poorer performing variant(s) will always get a significant share of your traffic. With the multi-armed bandit approach, you allocate increasingly less traffic to poorly performing variants.

What is multi-armed bandit testing

A multi-armed bandit approach allows you to dynamically allocate traffic to variations that are performing well while allocating less and less traffic to underperforming variations. Instead of two distinct periods of pure exploration and pure exploitation, bandit tests are adaptive, and simultaneously include exploration and exploitation. As Optimizely wrote recently, ” multi-armed bandit optimizations aim to maximize performance of your primary metric across all your variations. They do this by dynamically re-allocating traffic to whichever variation is currently performing best. This will help you extract as much value as possible from the leading variation during the experiment lifecycle, so you avoid the opportunity cost of showing sub-optimal experiences.”

Multi-armed bandit testing is a Bayesian approach to AB testing. As Shawn Lu writes in a post titled Beyond A/B testing, “The foundation of the multi-armed bandit experiment is Bayesian updating. Each treatment (called “arm”) has a probability of success, which is modeled as a Bernoulli process. The probability of success is unknown, and is modeled by a Beta distribution. As the experiment continues, each arm receives user traffic, and the Beta distribution is updated accordingly.”

A recap on ABn testing

To compare bandit testing with ABn testing (AB is with two variants, a test and control, n allows for additional variables), let’s quickly recap how AB testing works. Alex Atkins summarizes it succinctly, writing “in statistical terms, a/b testing consists of a short period of pure exploration, where you’re randomly assigning equal numbers of users to Version A and Version B. It then jumps into a long period of pure exploitation, where you send 100% of your users to the more successful version of your site.”

Benefits of multi-armed bandit testing

Bandit algorithms try to minimize opportunity costs and regret (the difference between your actual return and the return you would have collected had you deployed the optimal options at every opportunity). Rather than letting an AB test run until it is statistically significant, a bandit test moves subjects into the best performing group faster, allowing you to capture more gains. Matt Gershoff writes, ““Some like to call it earning while learning. You need to both learn in order to figure out what works and what doesn’t, but to earn; you take advantage of what you have learned. This is what I really like about the Bandit way of looking at the problem, it highlights that collecting data has a real cost, in terms of opportunities lost.”

A related advantage of multi-armed bandit testing is you make fewer mistakes. An A/B test will always send a significant portion of traffic to the sub-optimal group.

Also, as Shawn Lu writes, “[an] advantage of bandit experiment is that it terminates earlier than A/B test because it requires much smaller sample. In a two-armed experiment with click-through rate 4% and 5%, traditional A/B testing requires 11,165 in each treatment group at 95% significance level. With 100 users a day, the experiment will take 223 days. In the bandit experiment, however, simulation ended after 31 days, at the above termination criterion.” if the treatment group is clearly superior, we still have to spend lots of traffic on the control group, in order to obtain statistical significance.”

Finally, while not mathematically an advantage, bandit testing relieves the pressure to end a test too early. With ABn testing, frequently you will see one option perform better “directionally” and decide, or be forced to decide, to terminate the test and move everyone to the higher performing bucket before you get significant results. Unfortunately, this sometimes leads to picking an option that would be reversed once there is more data.

Why multi-armed bandit is not always the correct approach

The value of bandit testing does not mean you should abandon completely ABn testing. In Lu’s post, he writes “the convenience of smaller sample size comes at a cost of a larger false positive rate.” That is, you end up sometimes gravitating to the sub-optimal solution.

Alex Atkins also writes, “in essence, there shouldn’t be an ‘a/b testing vs. bandit testing, which is better?’ debate, because it’s comparing apples to oranges. These two methodologies serve two different needs.”
A/B testing is a better option when the company has large enough user base, when it’s important to control for type I error (false positives), and when there are few enough variants that we can test each one of them against the control group one at a time.”

The Bandit Option

While multi-armed bandit testing is not always a better option than ABn testing, you should look closely at using bandit testing when possible. It can reduce the opportunity cost of your testing and relieve pressure to terminate tests prematurely.

Key takeaways

  • While AB testing is the most common method of optimizing between alternatives, in many situations the multi-armed bandit approach is optimal.
  • A multi-armed bandit approach allows you to dynamically allocate traffic to variations that are performing well while allocating less and less traffic to underperforming variations.
  • Multi-armed bandit testing reduces regret (the loss pursing multiple options rather than the best option), is faster and lowers the risk of pressure to end the test prematurely.

Slide1

Share this:

  • Facebook
  • LinkedIn

Like this:

Like Loading...
Analytics Bayes' Theorem General Social Games Business General Tech Business Social CasinoA/B testing analytics multi-armed bandit testing
1 Comment

How to overcome survivorship bias

by Lloyd MelnickMay 14, 2019March 4, 2019

A few months ago I shared a story and post on Facebook about survivorship bias and was amazed how often it was liked and shared. It also highlights the risk of survivorship bias in the gaming and gambling space. The image and blurb told the story how the navy analyzed aircraft that had been damaged and based future armament decisions on where they had received battle damage, thus they were going to increase the armor on the wingtips, central body and elevators. These were the areas that showed the most bullet holes.

Facebook plane story

One statistician, Abraham Wald, the founder of statistical sequential analysis, however fortuitously stopped this misguided effort. According to Wikipedia, “ Wald made the assumption that damage must be more uniformly distributed and that the aircraft that did return or show up in the samples were hit in the less vulnerable parts. Wald noted that the study only considered the aircraft that had survived their missions—the bombers that had been shot down were not present for the damage assessment. The holes in the returning aircraft, then, represented areas where a bomber could take damage and still return home safely. Wald proposed that the Navy instead reinforce the areas where the returning aircraft were unscathed, since those were the areas that, if hit, would cause the plane to be lost.”

Survivorship bias is universal

Survivorship bias occurs everywhere. If you are a poker player, you may have a hand of three of clubs, eight of clubs, eight of diamonds, queen of hearts and ace of spades. The odds of that particular configuration are about three million to one, but as economist Gary Smith writes in Standard Deviations, “after I look at the cards, the probability of having these five cards is 1, not 1 in 3 million.”

Another example would be professional basketball. If you look at the best professional basketball players, a high percentage never went to university for more than one year. From this information, you (or your teen son) may infer the best path to the NBA is going to university for one year or less. The reality is that there are millions (if not billions) of people who went to university for less than a year and never played in the NBA (or even the G League). The LeBron Jameses and DeAndre Aytons are likely in the NBA despite playing less than a year in college due to their great skill, not because they did not go to university for more than a year.

As an investor, survivorship bias is the tendency to view the fund performance of existing funds in the market as a representative comprehensive sample. Survivorship bias can result in the overestimation of historical performance and general attributes of a fund.

In the business world, you may go to a Crossfit gym that is packed with the owner making a great living. You decide to leave your day job and replicate his success. What you did not see is the hundreds of Crossfit gyms that are not profitable and have closed.

The problem exists in gaming

You often see survivorship bias in the gaming and gambling space. People will look at a successful product and select a couple of features or mechanics they believe have driven the success. They then try to replicate it and fail miserably, only to then wonder why the strategy did not work for them. What they fail to analyze is the many failed games (for every success there are at least 8-10 failures) because they do not even know they exist. The failed games may have had more of the feature you are replicating. Getting a star like Kim Kardashian is a great idea if you only look at Kim Kardashian: Hollywood, but if you look at the hundreds of other IPs that have failed your course of action might be very different.

Survivorship bias can also lend its ugly head when building a VIP program. You talk to your VIPs and analyze their behavior, thus building a program that reinforces what they like about the game. What you neglect, however, is that other non-existent features might have created even more VIPs.

In the gambling space, you may look at a new blackjack variant that is doing great and build a strategy around creating new variants of classic games. What you did not see is all the games based on new variants that have failed.

Avoiding survivorship bias

Looking simply at successes, or even failures, leads to bad decision making. When looking at examples in your industry or other industries, you need to seek out both the successes and failures. With the failures, you need to make sure they are the failures (not the airplanes that returned shot up but the ones that were destroyed). You also should not use others successes or failures as a short cut to robust strategy decisions. You need to analyze the market, understand your strengths-weaknesses-opportunities-threats (SWOT) and do a blue ocean analysis. Only then will you build a strategy that optimizes your likelihood for success.

Key takeaways

  • In WW2, by analyzing surviving aircraft the US navy almost made a critical mistake in adding armor to future airplanes. The planes that returned were actually survivors, while it was the planes that were destroyed that showed where on the plane was the greatest need for new armor. This phenomenon is called survivorship bias.
  • This bias extends into the gaming and gambling space, as companies analyze what has worked in successful games but do not know if it also failed (perhaps to a greater degree) in products that no longer exist.
  • Rather than just looking at survivors or winners to drive your strategy, you should do a full SWOT and Blue Ocean analysis, that is the strongest long-term recipe to optimize your odds of success.

Share this:

  • Facebook
  • LinkedIn

Like this:

Like Loading...
Analytics General Social Games Business General Tech Business Social Casinoanalytics bias survivor bias Survivorship bias
1 Comment

Lifetime Value Part 26: My most valuable retention KPIs

by Lloyd MelnickFebruary 5, 2019January 4, 2019

I have written many times about customer lifetime value (LTV)and how it is the critical determinant of a company’s success (any company, from mobile games to retailers). A user’s lifetime value has to exceed the cost of acquiring the customer, otherwise companies cannot grow and will eventually die.

Last year, I discussed that out of the three key components of LTV – monetization, virality and retention – retention was the one most critical for success. While people sometimes focus on monetization, its impact on the long-term value of a customer is limited. Think of a retail store. Would they rather have a customer who comes in, makes a $100 purchase but never returns or somebody who comes in every week and makes a purchase ranging from $10 to $25? Obviously, they would prefer the latter. Successful businesses, games, apps, have great retention, thus creating high LTVs and allowing for more marketing spend.

While the mathematical case for focusing on retention is incontrovertible, many companies have not perfected how to measure retention effectively. Most social game companies, among the most sophisticated users of analytics, rely on measuring retention by D1/D7/D30 retention (how many players who installed on Day 0 are play after one day, seven days and thirty days, respectively). While this method is an acceptable (and sometimes powerful) way of tracking how new users are performing, even D30 retention only reflects behavior of customers acquired in the last month. It does not show how well the game or company is retaining its existing customer base.

When I was at Zynga, I came across a metric that perfectly captures how well you are performing with your existing customers, CURR (current user return rate). CURR is complemented by NURR (new user return rate) and RURR (returning user return rate). Since leaving Zynga, not only have I taken these KPIs with me, I have used them as a key focus for optimizing products. A post by Nathan Williams, SaaS Retention Metrics: Lessons from Free-to-Play Games, reminded me how important these KPIs are and how to best use them.

urr retention chart

CURR

CURR (current user return rate) is the most important KPI to track (or at least a tie with NPS). It shows how loyal your existing customers are; you should consider CURR the inverse of churn. If your CURR increases, it means you have improved your product’s appeal to existing players or customers, if CURR declines you have made your game worse. CURR is also an excellent way of looking at how your game is performing among different segments, VIPs versus payers versus never-spenders.

To calculate CURR, you start with all the users who played the game between t-14 (14 days before today, today minus 14) and t-20 and who used the product between t-7 and t-13, what percentage returned to play between t-0 and t-6. The benchmark for a good, but not great, game is 80 percent.

NURR

NURR (new user return rate) is a great metric for understanding how appealing your game is to players you have just acquired. A low NURR shows you have a bad initial experience (or a bad traffic source), turning off many users. It is virtually impossible to acquire players profitably with a low NURR.

To calculate NURR, take all the players who used the game for the first time between t-7 and t-13 and look at what percentage returned to the game between t-0 and t-6. You can benchmark NURR at about 30 percent, though it is dependent on the type of game and platform. There is much higher variance in NURR than CURR among successful games (a game on desktop could succeed with a much lower NURR than a game on Google Play).

RURR

RURR (return user return rate) shows how many people who had churned and returned to your game stay active. It is a great way of measuring how well your game can capitalize on CRM and paid reactivation campaigns. If the number is low, you are doing a great job of bringing players back but the product is still not compelling to these players.

You can calculate RURR by taking all the players who were active at some point but did not use the product between t-14 and t-20, and did use the product between t-7 and t-13, what percentage returned to play the game between t-0 and t-6. There is also significant variance in this benchmark but I usually target 40 percent for social casino games.

slide1

Use *URR to track product performance

Once you start monitoring CURR/RURR/NURR, you should use them to understand what is working and where there are issues. If you see a significant change in CURR, it is almost certainly caused by recent product changes. Low NURR indicates either you have broken your FTUE or you have added weak sources of traffic. A low RURR indicates your CRM or reactivation team is doing a good job but you need to add product features to keep the players you are brining back.

Key takeaways

  1. Retention is the key driver of customer lifetime value (LTV), and CURR/NURR/RURR are the most accurate metrics to track retention.
  2. CURR (current user return rate) is your most valuable metric, the percent of your current players who are staying active. It shows whether changes in your product are appealing to or deterring your player base.
  3. NURR (new user return rate) shows if your initial user experience is strong while RURR (return user return rate) shows if your game is appealing to players who have churned but decide to try it again.

Share this:

  • Facebook
  • LinkedIn

Like this:

Like Loading...
Analytics General Social Games Business General Tech Business Growth Lloyd's favorite posts LTV Social Casinoanalytics curr LTV retention
4 Comments

How to avoid misleading data, aka Fake Analytics

by Lloyd MelnickMay 8, 2018May 8, 2018

Someone I respect recently posted an article from a news source that I also respect, but the article actually highlighted how data can mislead, either intentionally or not. An article on the Guardian.com, Amazon Prime Video’s growth outpaces Netflix in UK, tells the story of how Prime Video is growing at a faster rate than Netflix. The sub-title stresses that, “cross-promotion to Amazon shoppers and new on-demand series rank it top in 2017.”

The article goes on to point out several reasons why Amazon is top in 2017:

  • New series of the Grand Tour and Transparent are fueling growth
  • Hefty cross promotion of Prime Video to regular Amazon shoppers is also contributing
  • Prime Video increased its subscribers to 4.3 million in 2017, representing 41% year-on-year growth
  • Netflix only grew 25% in the same period.

If you stopped reading the article there, and who reads an article until the end these days, you would think Amazon is doing a great job in the video market and Netflix should be very worried. If you worked at Amazon and get a similar report from your analytics team, you might high-five the head of Amazon Prime in the UK. If you were at Netflix and got a similar report from your analytics team, you might panic a little and divert resources to the UK.

The problem is that although the data is accurate it is misleading. The key figure is that Netflix added 1.6 million new subscribers in 2017, while Amazon added 1.3 million new subscribers for Prime Video in the UK. Thus Netflix actually extended its lead over Amazon by 300,000 customers in 2017. Netflix is in 8.2 million UK households (at the end of 2017), versus 3 million for Amazon.

How different would the story have been if the headline was Netflix extends lead by another 300,000. How different would the reception be at Amazon and Netflix respective headquarters if their analytics team presented data in this way.

Slide1

The mistake

The mistake in this case (and I will be generous and assume the Guardian was not click-baiting) is comparing growth rates (or any other rates) while neglecting the size of the relative base. It would be the same in football if you looked at Messi’s goal scoring versus a second year player. The latter may be scoring twice as many goals as he did as a rookie while Messi may have been flat or added a few. Thus the young player is growing his goal scoring 100% while Messi is adding only a few percent to his lifetime numbers. That does not mean that the second year player is either having as good a season as Messi or closing the gap.

The same happens in the mobile game world. Your slot game may be growing 100% month on month while Slotomania is growing 10% (not real numbers), but because their base is so high they are adding millions in revenue while you are still not profitable.

The key is only comparing trends when you are comparing apples to apples. Trends mean something if you are looking at two products or companies of comparable size in the same stage of their lifecycle. Looking at two auto companies who launched an SUV the same year in the same market makes sense, comparing growth rates of two automakers, one who is new and has no dealer network with one that has been around 100 years is worthless.

The answer

You need to look deeper into the numbers. Look at the absolute numbers. Look at the pricing. Look at the target market. Look at percent usage (in the Amazon case, how engaged are Prime users who may have bought it just to get free shipping versus Netflix users). The key to using data effectively is look deeply at the data and understand what is driving the results. You also need to make sure your analytics team does the same. It is very easy to make conclusions based on obvious trends. Avoid superficial analysis and, more importantly, superficial conclusions.

Key takeaways

  1. A recent article implied Amazon Prime Video was doing better than Netflix in the UK as it grew 41% versus 25% by Netflix.
  2. The article is misleading as Netflix actually added 300,000 more customers than Amazon. This obfuscation shows how data can mislead if you focus on trends but are not comparing comparable companies or products.
  3. The key to using data effectively is look deeply at the data and understand what is driving the results.

Share this:

  • Facebook
  • LinkedIn

Like this:

Like Loading...
General Social Games Business General Tech Business Growthamazon analytics Netflix
Leave a comment

How to manage your algorithms

by Lloyd MelnickMarch 23, 2016February 28, 2016

While everyone is focused on creating the most advanced algorithms for their predictive analytics and optimizing your team’s performance, I have not seen anything on how to manage your algorithms. A great article in Harvard Business Review – Algorithms Need Managers, Too by Michael Luca, Jon Kleinberg and Sandhil Mullainathan – does a great job of combining the two issues and providing a solution.

The authors begin by pointing out most businesses rely on predictions throughout their organization. The decisions can range from predicting a candidate’s performance and whether to hire them, what initiatives will have the highest ROI and what distribution channels will yield the most sales. Companies increasingly are using computational algorithms to make these predictions more accurate.

The issue is, if the predictions are inaccurate (and although they are computer generated, they are still predictions not facts) they can lead you into bad decisions. Netflix learned this the hard way when its algorithms for recommending movies to DVD customers did not hold when its users moved to streaming. More relevant to digital marketers, algorithms that generate high click through rates may actually bring in poor users not interested in your underlying game or product. As the authors write, “to avoid missteps, managers need to understand what algorithms do well – what questions they answer and what questions they do not.”

How algorithms can lead you amiss

An underlying issue when using algorithms is that they are different than people. They behave quite differently in two key ways:

  • Algorithms are extremely literal, they do exactly what they are told and ignore any other information. While a human would understand quickly that an algorithm that gets users that generate no revenue is useless, if the algorithms was just built to maximize the number of users acquired it would continue attracting worthless users.
  • Algorithms are often black boxes, they may predict accurately but not what is causing the action or why. The problem here is that you do not know when there is incomplete information or what information may be missing.

Once you realize these two limitations of algorithms, you can then develop strategies to combat these problems. The authors then provide a plan for managing algorithms better.

Slide1

Be explicit about all of your goals

When initiating the creation of an algorithm, you need to understand and state everything you want the algorithm to achieve. Unlike people, algorithms do not understand the implied needs and trade-offs necessary often to optimize performance. People understand the end goal and then backward process how to best achieve that eventual goal. There are also soft goals to most initiatives, and these goals are often difficult to measure (and thus input into your algorithms). There could also be a goal of fairness, for example a bank using an algorithm to optimize loan behavior may not provide enough loans in areas where it feels a moral obligation to do so. Another example could be where you may want to optimize your business units sales but the behavior could negatively impact overall sales of your company.

The key is to be explicit about everything you hope to achieve. Ask everyone involved to list their soft goals as well as the primary objective. Ask people to be candid and up-front. With a core objective and a list of concerns in front of them, the algorithm’s designer can then build trade-offs into the algorithm. This process may entail extending the objective to include multiple outcomes, weighted by importance.

Minimize myopia

Algorithms tend to be myopic, they focus on the data at hand and that data often pertains to short-term outcomes. There can be a tension between short-term success and long-term profits and broader corporate goals. People understand this, computer algorithms do not.

The authors use the example of a consumer goods company that used an algorithm to decide to sell a fast-moving product from China in the US. While initial sales were great, they ended up suffering a high level of returns and negative customer satisfaction that impacted the brand and overall company sales. I often see this problem in the game industry, where product managers find a way to increase in-app purchases short term but it breaks player’s connection with the game and long-term results in losses.

The authors suggest that this problem can be solved at the objective-setting phase by identifying and specifying long-term goals. But when acting on an algorithm’s predictions, managers should also adjust for the extent to which the algorithm is consistent with long-term aims.

I recommend using NPS to balance out short term objectives with the long-term health of the product and company. I have written before about NPS, Net Promoter Score, which is probably the most powerful tool to measure customer satisfaction. It is also highly correlated with growth and success. By ensuring you keep your NPS high, you are providing a great way to look holistically at the success of specific initiatives.

Chose the right data inputs

Using the right data can make your algorithms much more effective. When looking at a game like Candy Crush, you can create levels by looking at when people abandon the game and decompose the levels before abandonment. However, by adding social media posts to the your data, you could get a more holistic view of which levels players are enjoying and thus build a more compelling product.

The authors also point to an example with the City of Boston. By adding Yelp reviews to what health inspectors use to determine what restaurants to inspect, they were able to maintain their exact same performance but with 40 percent fewer inspectors. Thus, the new data source had a huge impact on productivity.

The authors point to two areas of data that can improve your algorithms:

    • Wider is better. Rather than focusing on more data, the amount of data you know about each customer determines the width. Leveraging comprehensive data is at the heart of prediction. As the authors write, “every additional detail you learn about an outcome is like one more clue, and it can be combined with clues you’ve already collected. Text documents are a great source of wide data, for instance; each word is a clue.”
    • Diversity matters. Similar to your investment strategy, you should use data sources that are largely uncorrelated. If you use data that moves closely to your data sources, you will have the illusion of using multiple data sources but really only be looking at one angle of the data. If each data set has a unique perspective, it creates much more value and accuracy.

Understand the limitations

As with anything, it is also critical to understand the limitations of algorithms. Knowing what your algorithm will not do is equally important as understanding how it helps. Algorithms use existing data to make predictions about what might happen with a slightly different setting, population, time, or question. “In essence, you are transferring an insight from one context to another. It’s a wise practice, therefore, to list the reasons why the algorithm might not be transferable to a new problem and assess their significance,” according to the authors.

As the authors point out, “ remember that correlation still doesn’t mean causation. Suppose that an algorithm predicts that short tweets will get retweeted more often than longer ones. This does not in any way suggest that you should shorten your tweets. This is a prediction, not advice. It works as a prediction because there are many other factors that correlate with short tweets that make them effective. This is also why it fails as advice: Shortening your tweets will not necessarily change those other factors.”

Use algorithms, just use them smartly

This post is not intended for you to avoid using algorithms, it is actually the opposite goal. Algorithms are increasingly powerful and central to business success. Whether you are predicting how consumers will react with a feature, where to launch your product or who to hire, algorithms are necessary to get great results. Given the central importance of these algorithms, however, it is even more crucial to use them correctly and optimize their benefit to your company.

Key takeaways

  1. Algorithms are increasingly powerful and central to business success. Given the central importance of these algorithms it is even more crucial to use them correctly and optimize their benefit to your company.<
  2. Problems with algorithms result from them being literal (they do exactly what you ask) and are largely a black box (they do not explain why they are offering certain recommendations).
  3. When building algorithms, be explicit about all your goals, consider the long-term implications and make sure you are using as broad data as possible.

Share this:

  • Facebook
  • LinkedIn

Like this:

Like Loading...
Analytics General Social Games Business General Tech Business Machine Learningalgorithms analytics goals Machine learning Net Promoter Score NPS
Leave a comment

Why data is more important than hair: The Donald Trump story

by Lloyd MelnickFebruary 3, 2016

There is a great article on Politico, How Trump Let Himself Get Out-Organized, that explains how Trump’s Iowa debacle was a result of a failed analytics strategy. Trump made the same mistake many companies commit, he felt a strong brand and what he believe compelling product allowed him to under-invest in analytics. This issue was compounded by the aggressive use of analytics by competitors. Although this occurred in the political arena, there are lessons for all businesses.

The article explains that despite Trump’s strength in the polls, he did not have “the tools they needed, which is why they overpromised and underperformed.”

Slide1

Penny wise and pound foolish

While Ted Cruz and Marco Rubio spent millions building sophisticated voter targeting machines, Trump did not start building a data operation to target voters until mid-October. It did not even start buying data (i.e. voter lists, etc) until November and waited to December to start using the Republican National Committee’s (RNC’s) voter file.

The Trump campaign declined to use Cambridge Analytica, a behavioral modeling company with political expertise, due to cost. Cruz, however, retained Cambridge Analytica’s services and the firm is now widely credited with engineering Cruz’s cutting-edge targeting operation. Rubio, who also over delivered on expectations, spent $750,000 for an outside company to assist in its data operations. Trump overall spent $560,000 on data services in 2015, compared to $3.6 million by the Cruz campaign. It is also about $700,000 less than Trump spent on hats.

You also need the analytics team

The Iowa caucas also showed the value of having a strong analytics team, not simply software. Cruz’s data team, which they call the Oorlog (the Afrikaner word for ‘war’) project, includes four full-time data scientists and embedded talent from Cambridge Analytics.

The Rubio campaign, which also exceeded expectations, has also invested heavily in its analytics team. It has a 22-person data war room in DC.

The Cruz campaign also hired ten canvassers (and recruited many volunteers) to go door-to-door to contact people the analytics suggested were supportive or could be persuaded. Traditionally, these so-called match rate initiatives are 50 percent successful but with Cruz’s advanced analytics the success rate reached 70 percent. The Cruz campaign also used the voter profiles to shape its strategies for most marketing activities, from television ad buys to telephone banks.

Micro-segmentation

Micro-segmentation, or creating very small customer segments and treating them uniquely, is another area where Trump fell down compared to Cruz. As Politico wrote, the Cruz campaign, “built a list of more than 9,000 Iowans who were still on the fence between their candidate and Trump. The team divided the undecided voters ― who were heavily evangelical and 91 percent male ― into more than 150 different subgroups based off ideology, religion and personality type, Wilson said. It used Facebook experiments to determine which issues jazzed up their voters the most.”

The lesson

No matter how strong you feel your product is, or how well it has performed in the past, you are vulnerable to competitors who may have a superior analytics solution. To combat this risk, you not only need to match the investment your competitor’s are making in analytics and look at micro-segmentation but also build a world class data team.

Key Takeaways

  • Donald Trump’s loss to Ted Cruz in Iowa can be attributed to Cruz’s superior use of analytics to build a competitive advantage.
  • Cruz invested much more in both analytic products and a great data team and it helped him get pro-Cruz people to caucus.
  • Cruz also did a great job of micro-segmenting potential voters into more than 150 different subgroups based off ideology, religion and personality type and used Facebook experiments to determine which issues were most relevant for each subgroup.

Share this:

  • Facebook
  • LinkedIn

Like this:

Like Loading...
Analytics General Social Games Business General Tech Business Uncategorizedanalytics data Donald Trump iowa micro-segmentation politico Ted Cruz
1 Comment

Trends in Analytics from BDA Conference

by Lloyd MelnickJune 18, 2015January 4, 2016

On Tuesday I went to the BDA Conference on Big Data Analytics. Conferences like these are always interesting to see at a high-level how analytics and its uses are evolving. This conference was no different and some of the trends that came through the various sessions suggest where future opportunities will be to leverage analytics:

  • A big challenge, and opportunity, is integrating data from multiple sources to get a more complete picture of your customers. Until recently, analyzing data in your product was the primary way to understand users (and play patterns in games) but now there is valuable data available from multiple sources. Data from social media (what people are saying about you and your product, sentiment, etc), data from beacons and other sensors, data from user acquisition, etc. When you integrate this data, you get a more complete understanding of your users and their motivations.
  • Data is connecting people and things, expanding the universe of data. There is now extensive data on how people interact with their surroundings and this will grow.
  • Using data is moving from the province of data scientists and analysts to everyone in the organization. This trend is driven by easier to use and manipulate tools, not by increased training. Designers and product managers and marketers are not becoming data experts but the tools now allow easy visualization, point and click charts, swipe and pinch access.
  • Top companies are now using the various data sources to understand holistically the customer journey and then driving activities to increase the value from the customer during their journey. The critical change is that you are using different data sources to pick up the user at different points (think of a race with cameras along the course and how the telecast switches between cameras).
  • People are now using, and expecting, data on a real time basis. Increasingly everyone in the organization has real time access to data and can drive actions based on this information. No longer are people waiting for the charts on yesterday’s activity.

Key takeaways

  1. The universe of data is exploding, with multiple data sources and good analytics now blends this data to provide a complete picture of the customer.
  2. Data is no longer being controlled by a few people in BI (business intelligence), user-friendly tools are allowing everyone in the organization to access and control data easily to enhance their decision-making
  3. Data allows companies to see the entire customer journey, with different data sources filling in different parts of the journey.

BDA

Like this:

Like Loading...
Analytics General Social Games Business General Tech Businessanalytics BDA big data blending customer journey
Leave a comment

Why your next feature probably won’t make an impact

by Lloyd MelnickJune 11, 2015January 4, 2016

I have been around many games and products that had poor results but the game teams kept thinking that everything would be fixed with the new features they had on the roadmap. It never worked. A recent post by Andrew Chen, “The Next Feature Fallacy,” shows the metrics of why adding product does not turnaround an unsuccessful one.

New features won’t change the key metrics

Chen leads off his post with the sobering metrics that for a typical web app (mobile apps see similar numbers) that get, 20 percent of visitors sign up, 80 percent finish on-boarding, 40 percent return the next day, 20 percent return the next week and 10 percent return after 30 days. Thus, for every 1,000 visitors, you still have 20 after 30 days (and this is not even a poorly performing app). Chen’s graph below highlights this funnel:

Andrew Chen's tragic curve

Chen points out that most features will not impact this curve for two reasons:

  1. Too few people will use the feature. Most features target retained users, but as the above shows that if it is a feature post-D7 (day 7) it will only touch 20 out of 1,000 users, and if it is D7 it only impacts 40.
  2. The other key failing is that the feature will make a small impact when users to engage. This is often the case when key functions are displayed like optional actions outside of the onboarding process.

This problem of focusing on features that will not fix your game are a result of focusing on users/players already deeply engagement and trying to make their experience better. Continue reading “Why your next feature probably won’t make an impact” →

Like this:

Like Loading...
Analytics General Social Games Business General Tech Businessanalytics features product management
1 Comment

Posts navigation

← Older posts
  • Home
  • About

Get my book on LTV

The definitive book on customer lifetime value, Understanding the Predictable, is now available in both print and Kindle formats on Amazon.

Understanding the Predictable delves into the world of Customer Lifetime Value (LTV), a metric that shows how much each customer is worth to your business. By understanding this metric, you can predict how changes to your product will impact the value of each customer. You will also learn how to apply this simple yet powerful method of predictive analytics to optimize your marketing and user acquisition.

For more information, click here

Follow The Business of Social Games and Casino on WordPress.com

Enter your email address to follow this blog and receive notifications of new posts by email.

Join 1,373 other followers

Most Recent Posts

  • Podcasts now available
  • Lessons for gaming and tech companies from the Peter Drucker Forum
  • Chaos Theory, the Butterfly Effect, and Gaming
  • How to give help without micromanaging

Lloyd Melnick

This is Lloyd Melnick’s personal blog.  All views and opinions expressed on this website are mine alone and do not represent those of people, institutions or organizations that I may or may not be associated with in professional or personal capacity.

I am a serial builder of businesses (senior leadership on three exits worth over $700 million), successful in big (Disney, Stars Group/PokerStars, Zynga) and small companies (Merscom, Spooky Cool Labs) with over 20 years experience in the gaming and casino space.  Currently, I am the GM of VGW’s Chumba Casino and on the Board of Directors of Murka Games and Luckbox.

Topic Areas

  • Analytics (114)
  • Bayes' Theorem (8)
  • behavioral economics (8)
  • blue ocean strategy (14)
  • Crowdfunding (4)
  • General Social Games Business (457)
  • General Tech Business (194)
  • Growth (88)
  • International Issues with Social Games (50)
  • Lloyd's favorite posts (101)
  • LTV (54)
  • Machine Learning (10)
  • Mobile Platforms (37)
  • Social Casino (51)
  • Social Games Marketing (104)
  • thinking fast and slow (5)
  • Uncategorized (32)

Social

  • View CasualGame’s profile on Facebook
  • View @lloydmelnick’s profile on Twitter
  • View lloydmelnick’s profile on LinkedIn

RSS

RSS Feed RSS - Posts

RSS Feed RSS - Comments

Categories

  • Analytics (114)
  • Bayes' Theorem (8)
  • behavioral economics (8)
  • blue ocean strategy (14)
  • Crowdfunding (4)
  • General Social Games Business (457)
  • General Tech Business (194)
  • Growth (88)
  • International Issues with Social Games (50)
  • Lloyd's favorite posts (101)
  • LTV (54)
  • Machine Learning (10)
  • Mobile Platforms (37)
  • Social Casino (51)
  • Social Games Marketing (104)
  • thinking fast and slow (5)
  • Uncategorized (32)

Archives

  • March 2021
  • February 2021
  • January 2021
  • December 2020
  • November 2020
  • October 2020
  • September 2020
  • August 2020
  • July 2020
  • June 2020
  • May 2020
  • April 2020
  • March 2020
  • February 2020
  • January 2020
  • November 2019
  • October 2019
  • September 2019
  • June 2019
  • May 2019
  • April 2019
  • March 2019
  • February 2019
  • January 2019
  • December 2018
  • June 2018
  • May 2018
  • April 2018
  • March 2018
  • February 2018
  • January 2018
  • December 2017
  • June 2017
  • May 2017
  • April 2017
  • March 2017
  • February 2017
  • January 2017
  • December 2016
  • November 2016
  • October 2016
  • September 2016
  • June 2016
  • May 2016
  • April 2016
  • March 2016
  • February 2016
  • January 2016
  • December 2015
  • November 2015
  • October 2015
  • September 2015
  • July 2015
  • June 2015
  • May 2015
  • April 2015
  • March 2015
  • February 2015
  • January 2015
  • December 2014
  • November 2014
  • October 2014
  • September 2014
  • August 2014
  • July 2014
  • June 2014
  • May 2014
  • April 2014
  • March 2014
  • February 2014
  • January 2014
  • December 2013
  • November 2013
  • October 2013
  • September 2013
  • August 2013
  • July 2013
  • June 2013
  • May 2013
  • April 2013
  • March 2013
  • February 2013
  • January 2013
  • December 2012
  • November 2012
  • October 2012
  • September 2012
  • August 2012
  • July 2012
  • June 2012
  • May 2012
  • April 2012
  • March 2012
  • February 2012
  • January 2012
  • December 2011
  • November 2011
  • October 2011
  • September 2011
  • August 2011
  • July 2011
  • June 2011
  • May 2011
  • December 2010
April 2021
S M T W T F S
 123
45678910
11121314151617
18192021222324
252627282930  
« Mar    

by Lloyd Melnick

All posts by Lloyd Melnick unless specified otherwise
Google+

Enter your email address to subscribe to this blog and receive notifications of new posts by email.

Join 1,373 other followers

Follow Lloyd Melnick on Quora

RSS HBR Blog

  • What Went Wrong with the Boeing 737 Max?
    Harvard Business School professor Bill George examines the Boeing 737 Max crashes through the lens of industry and corporate culture.
  • Partnering with a Technology Consultancy Can Help Scale Your Digital Transformation - SPONSOR CONTENT FROM WWT
    Sponsor content from WWT.

RSS Techcrunch

  • An error has occurred; the feed is probably down. Try again later.

RSS MIT Sloan Management Review Blog

  • Why Less Is More in Data Migration
    As the pandemic continues, companies are racing to transfer data from old, bloated IT systems to more nimble, modern setups in order to launch new online services and maintain operating systems remotely. But few of these large-scale initiatives proceed as planned or deliver promised results. Many multiyear IT data migration programs fail — often at […]
  • The Best of This Week
    With Remote Collaboration, Sometimes Conflict Is a Good Thing Remote work environments lack the spontaneous exchange of ideas that can naturally occur in an in-office setting. To spur innovation in this challenging context, leaders have to be skillful in connecting with employees at all levels of the organization while encouraging rigorous debate. Why Good L […]
Website Powered by WordPress.com.
Cancel

 
Loading Comments...
Comment
    ×
    <span>%d</span> bloggers like this: