Skip to content Skip to navigation

The Business of Social Games and Casino

How to succeed in the mobile game space by Lloyd Melnick

Month: February 2019

Building an analytic-driven greenlight process

by Lloyd MelnickFebruary 26, 2019April 11, 2020

Launching new products is vital for the continued success of any game company but surprisingly few have a robust process for prioritizing projects. For a successful game company, new games provide an avenue for growth, as existing games will eventually plateau. Moreover, they mitigate the risk that your current successful game starts to decline.

For a young company or one still trying to make it into the top-tier, new games are even more critical. They provide a mechanism for disrupting the top-10, a new offering that can place you among the top game companies. Without a successful new product, you cannot become a successful company.

While the importance of new games is clear, it is surprising how few companies devote sufficient resources or put much process behind greenlighting projects with the highest ROI. Some of the most metrics driven companies do not use analytics when deciding on new games; they instead count on the intuition of a small circle of executives (or one person). Others start projects without any form of prioritisation. In the worst case, some do not even start new games and have nothing available when their existing products decline.

These companies are not only leaving money on the table, but potentially putting their survival at risk. Everyone has limited resources and by putting resources in the wrong projects, you may miss out on the games needed to survive and thrive.

The game industry in many ways resembles Major League Baseball in Moneyball. Management “knew” what made a good baseball player and used their intuition when building their baseball teams. The entire sport was disrupted when Billy Beane used analytics rather than intuition to build a winning team, with less resources than his competitors.

Since entering the game industry in 1993, and almost always managing limited resources, I have focused on refining the greenlight process so it drives highest ROI. Using lessons from Moneyball, I have identified three steps that lead to optimizing the ROI from new game projects. While you will still have failures (even Billy Beane drafts some busts), you will increase the odds of creating a successful product.

Step 1: Market Data

To determine your new product priorities, you first need to have a deep understanding of your market. A common mistake is to look at the market too high level or focus on your own experiences. In the former case, assume you are a social slots developer. It provides no value to know the gaming market is expected to grow 15 percent next year or even that social casino will grow an average of 8 percent every year for the next five years (both numbers are examples, not actual projections). This type of data is not actionable, it does not help you find market opportunities.

Focusing on your own experience is potentially very misleading. You may have had one product do very well. This experience could create a bias (availability bias) that there is a great opportunity in the market segment where you have done well. The reality might be you filled a niche or provided a superior alternative to the existing top competitor but that there is a very small addressable market and you already dominate it. You will also not see the biggest opportunities in the industry, another company might have launched a comparable product and seen 5X the growth by being in another market segment. If you focus on your experience, you will miss finding the biggest opportunities.

Instead, the best way to look at the market is to focus on your sub-sector, for example social casino, and understand what companies have done well and what companies have underperformed in the past twelve months. The graphic below from an Eilers presentation shows a better way to look at market data:

market data

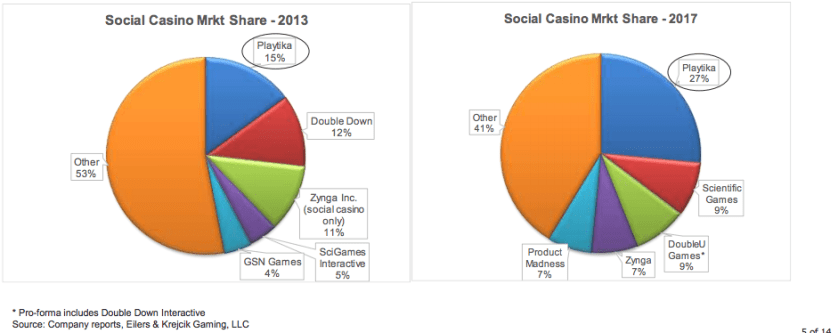
Using the data above, you would then see what companies grew their market share and where it shrunk. The key to this step in the green light process is to analyse the data to understand where market opportunities exist. In the chart above, Product Madness went from Other to 7 percent share. You then dive deeper and learn that the growth was largely due to their pioneering progressive jackpots, so that feature then represents an opportunity. Conversely, DoubleDown dropped from 12 percent to 9 percent share, so it suggests you should deprioritize building a product that is comparable to DoubleDown’s casino.

Step 2: Blue Ocean

While it is important to understand the market, it is more important to determine Blue Ocean opportunities. The market data, by definition, only shows what you and your competition are doing. Thus, any new products based on this data will be launched into a competitive environment. Moreover, other companies are doing the same analysis, increasing competition in the areas that you have identified.

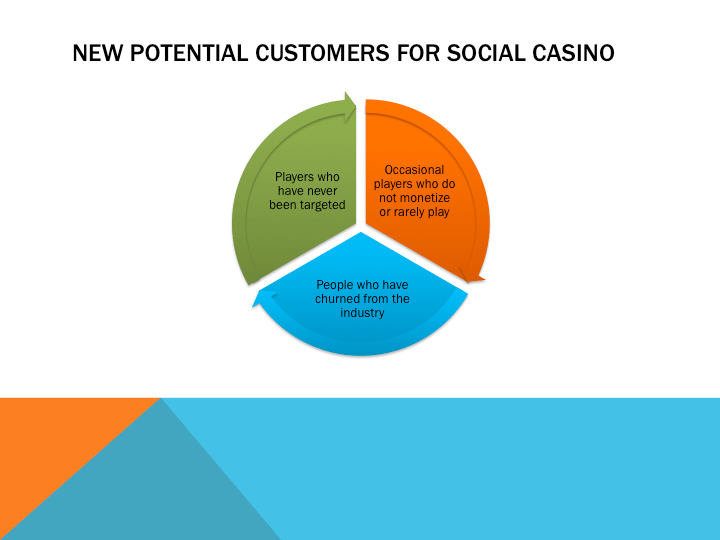
As I wrote last week, the bigger opportunity is to identify non-customers and bring them into the market. This Blue Ocean strategy has higher returns than focusing on creating a better product than your competitors for an existing market segment.

To look for Blue Ocean opportunities, you first need to create a Strategy Canvas. This canvas shows the features existing companies use to compete. You can use it to create a strategy profile that is distinctive from the competition by adding new features to compete on, eliminating some, raising others while reducing some. Below is a hypothetical example of a canvas you would create if you were with Aristocrat’s Product Madness team and looking at a new initiative (you can create these canvases at the Blue Ocean Academy website):
slide1

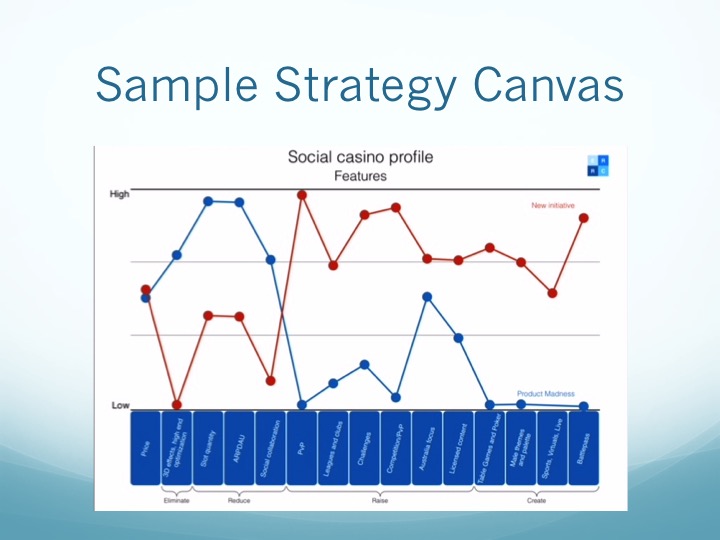
Once you have a strategy canvas, the next phase to building new product ideas is to understand what the canvas shows you should adjust. First, consider what you will add to the product to appeal to non-customers, by both increasing current features and including entirely new attributes.

As you will see above, to compete in a different market space, you first need to reduce (focus less) on some features you and your competitors consider important. Even more challenging, but more critical, is determining what features you will no longer compete on, the ones you will eliminate.

The reduce and eliminate element is as important as deciding what to add or increase and it is much more difficult. Many companies make the mistake of just adding to their product, feature creep. This results in a bloated product that ends up appealing to nobody. It often makes costs too high to justify the new product. It takes discipline to reduce and eliminate but that is the key to building a successful Blue Ocean product.

Step 3: Ideas and Analysis

Once you have completed the first two steps, you integrate the results to prioritize your greenlight process and create a compelling product roadmap. The key is taking the information you have gleaned from the market, the analysis you have done on non-customers (Blue Ocean) and an introspection of your capabilities and combine it to understand your company’s best opportunities.

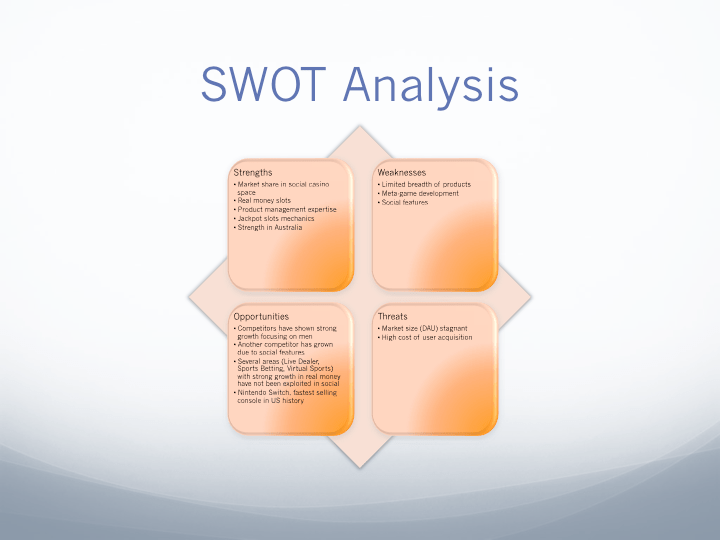
First, create a SWOT (strength/weakness/opportunity/threat] analysis. Strengths and weaknesses are focused on your company, so it is important to be objective and look at where your company is better or worse than competitors. Opportunities and threats largely comes from the first Steps (market and Blue Ocean analysis), how is the market evolving, why are companies are experiencing growth or declines and what products potentially appeal to non-customers. Below is a sample SWOT analysis:

slide1

Following the SWOT analysis, you then brainstorm game ideas that take advantage of your strength and the opportunities while mitigating your weaknesses. There are many great articles on ideation and brainstorming and I will not try to cover it here. At the end of this phase you will have a list of potential products.

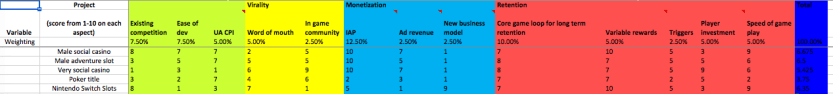
The final part of Step 3 is analysing these options to prioritize what products to move forward developing. Without this analysis, all you have are a lot of “good” ideas that different people want to move forward with. To prioritize these opportunities, create a SMART spreadsheet analysis. SMART is an acronym for a Simplified Multi-Attribute Rating Technique.

To create a smart analysis, you first think of all the attributes that impact whether a game will be successful. You start with the meta-categories like virality, retention, monetization, etc., and then identify the sub-attributes in each meta-category (virality could be word of mouth and community). You then weigh each of these sub-attributes on how much they contribute to the overall success of the product, with the total weight equalling 100%. An attribute related to retention could have a weight of 30 percent or a less important attribute like triggers could be 3 percent. You then create a row for each product and give it a score on every attribute from 1 to 10. You multiply that score by the weight of the attribute and sum them up for each product. The products with the highest score(s) should be greenlit while those with a low score should be abandoned. Below is a sample SMART spreadsheet:
smart analysis

The SMART analysis is indispensible as it gives you a prioritized list of projects.

A strong greenlight process will create a strong product pipeline

A good greenlight process is critical to long-term success. It ensures you will have a steady stream of products to gain market share and replace your declining products. After an analysis of industry dynamics and opportunities to bring new customers into the industry, you need to synthesize that information into actionable insights. Creating a SWOT analysis and then SMART spreadsheet allows you to create a prioritized list of projects to focus your development efforts.

Key takeaways

  • Launching new games is critical for continued success but very few companies have a strong analytic process for prioritizing projects. By implementing a good framework, you can ensure your team is dedicated to the projects with the highest potential ROI.
  • The first two steps to a good greenlight process are understanding the market and uncovering opportunities to turn non-customers into customers. To understand the market, you should look at what competitors are enjoying success and which ones are lagging, then explore why. To identify opportunities to turn non-customers into customers, look at how you can change what the industry competes in by adding, increasing, reducing and eliminating attributes. It takes discipline to reduce and eliminate but that is the key to building a successful Blue Ocean product.
  • Once you have a list of potential projects from the industry analysis and review of non-customers, create a weighted spreadsheet (SMART analysis) that weighs the critical success factors and score each product. The products with the highest scores are the ones you should greenlight.


Share this:

  • Facebook
  • LinkedIn

Like this:

Like Loading...
Analytics blue ocean strategy General Social Games Business Lloyd's favorite posts Social CasinoGreen Light green light process SMART analysis SWOT
2 Comments

Think of Non-Customers First If You Want to Grow

by Lloyd MelnickFebruary 19, 2019April 11, 2020

I have been a consistent advocate of Blue Ocean strategy for years and a blog post by the Blue Ocean Team shows how you can grow your business by focusing on non-customers. Rather than fighting with your competitors to split up the existing pie, by thinking about non-customers you have greater growth potential. The blog post shows three types of non-customers and by understanding them you can tailor your product, new products or marketing to meet their needs. Below are the three groups of non-customers and my thoughts on their relevance to the social casino industry.

Non-customers who occasionally purchase or play

The first group of non-customers who represent a potential market are those who sit on the edge of the market, they purchase minimally your industry’s offerings but are always looking and quick to move to an alternative. The Blue Ocean Team uses the Pret A Manger chainas an example, as they appealed to people who reluctantly bought fast food but were looking for an alternative.

The social casino ecosystem includes many of these non-customers. These include gamers who are ready to skip to another genre (hypercasual, match-3, etc) if they see an appealing ad or the 90 plus percent of players who will play but not monetize. There are first-tier noncustomers waiting to be swayed in every industry.

Non-customers who refuse to become customers

The second group of non-customers is people who know an industry exists but have rejected it. As the Blue Ocean Team writes, “they have consciously thought about and considered your offering and then rejected it. It might be because another offering meets their needs better, or it could be that they simply can’t afford your offering. A second-tier noncustomer will compare your offering with another offering, weighing the pros and cons of each….The fact that second-tier noncustomers considered your industry means that you are far closer to possibly capturing them than you realize. So you need to find out why second-tier noncustomers refuse to use the products or services of your industry.”

In the social casino space, there are three types of these non-customers. The first is real money casino players (either land based or online) who have decided to not to play a free to play offering. They could have passed because they are only playing for economic reasons or the games offered are not what they prefer. The second is male casino players who may have rejected social casino because they consider them too “pink.” The third group is people who have tried social slot games but did not like the slot mechanic.

Non-customers who have not considered your industry

This category of non-customers has never considered your industry as an option. These non-customers have not been targeted ever by any company in your industry. This group is important to consider as it represents the largest potential market to penetrate (by definition it is everyone else). Existing companies in your industry assume these peoples needs are satisfied better by other industries.

In the social casino space, these are people who do not know or care that social slots games exist. It can be gamblers, gamers (other genres) or even people who have not played a mobile game.

What non-customers mean for social casino

Non-customers are particularly important to social casino as the ecosystem has been growing consistently but through better monetization rather than an increase in customers. If the industry is going to continue growing or if you want to gain market share, appealing to non-customers is the best option. First, you can tailor a product appeal to people who play but do not monetize or play rarely. Second, you can build a product for people who have churned, tried social casino games but left. Finally, you can build a social casino product for people who the industry has never targeted.

While the successful companies will come up with concepts internally and not rely on this blog to provide the answers, the key will be creating social casino products that do not simply replicate the existing games. That means looking at mechanics other than slots. Is also means creating an environment that is not targeting 40+ women. To successfully turn non-customers into customers, the parameters of the products also must shift.

Key takeaways

  1. While many companies look at their competitors and try to grow by building a better product for existing customers, the biggest opportunity exists in appealing to non-customers.
  2. There are three types of non-customers: those who occasionally purchase or play, those who have rejected the current offerings and those who have not considered your industry.
  3. If social casino is going to continue growing or if you want to gain market share, appealing to non-customers is the best option. First, you can tailor a product appeal to people who play but do not monetize or play rarely. Second, you can build a product for people who have churned, tried social casino games but left. Finally, you can build a social casino product for people who the industry has never targeted.

Share this:

  • Facebook
  • LinkedIn

Like this:

Like Loading...
blue ocean strategy General Social Games Business General Tech Business Growthblue ocean strategy customers Growth Strategy
1 Comment

Creating growth loops to scale your game

by Lloyd MelnickFebruary 12, 2019January 4, 2019

While apps and games have traditionally grown by having the acquisition team focus on the funnel, a recent blog post, Growth Loops are the New Funnels by growth guru Brian Balfour, shows a better strategy is to build growth loops. Rather than asking your marketing or user acquisition team to optimize user acquisition channels, growth loops has product and acquisition working holistically to build a product that will scale.

The traditional thinking

The strategy most game and app developers is create a great product, then optimize the acquisition funnel. After creating the product, they focus on optimizing the funnel below (testing different channels and strategies) to scale. This is a very KPI driven exercise, with each level of the funnel optimized through experiments and testing. The funnel consists of five categories, in this order:

  1. Acquisition. Helping as many users as possible discover the game. This can be discovered by visitors in the app store, downloads, app install, etc.
  2. Activation. Once acquiring a user, how many start playing the game (or using the app). This category can be measured by first spin (in a casino game), players who Facebook Connect, new accounts, completed tutorial, etc.
  3. Retention. Retention is the next, and arguably most important, category in the funnel. In games, this is often measured by how many players come by the next day (D1), return in a week (D7) or are active a month after installing (D30). Other good retention metrics are CURR (current rate of returning users) or engagement metrics (how much time spent in app).
  4. Referral. How many of your active players are helping bring new players. This category can be measured by actual referrals or K-score (number between 0-100 that indicates the strength of engagement between your product and your contacts, accounts, opportunities and leads).
  5. Revenue. The final layer of the funnel is revenue, how well you monetize the players. This metric is measured by ARPDAU (average revenue per daily active user), conversion rate (how many players spend), frequency of purchases, total lifetime spend, etc.

Successful companies would optimize the above funnel, testing different channels, creative, etc., at each step of the funnel, then optimizing spend to improve these KPIs.

The new approach

Rather than focusing on the five categories in the growth funnel, Balfour suggests a holistic approach to growth. As Balfour points out, while the growth funnel has helped many companies scale, it is over eleven years old and the industry has since evolved. Funnels lead to silos, where the product team has its own domain, growth has its empire while monetization owns its business. This strategy can lead to failure as the product is not built to optimize the channels where it will be distributed (e.g. the AppStores).

The key is building a product or game where growth is part of the core product loop, not a separate task done by a growth or acquisition or marketing team. As Balfour writes, “The fastest growing products are better represented as a system of loops, not funnels. Loops are closed systems where the inputs through some process generates more of an output that can be reinvested in the input. There are growth loops that serve different value creation including new users, returning users, defensibility, or efficiency.”

The key to a successful growth loop is the customer or player reinvesting the value of the loop to drive the initial elements of the loop Pinterest does this by investing in creating content that shows up high in search engines, users then find the content and either return to Pinterest or sign up for it, Pinterest then serves related content with the user saves, thus creating more searchable content (the beginning of the loop). SurveyMonkey has a growth loop where a user signs up, creates a survey, sends the survey out, when the recipients finish the survey the are served an opportunity to sign up with SurveyMonkey, and those sign-ups restart the loop.

Just as with your financial investments, a critical element of the power of growth loops is that they compound growth. Rather than the linear approach of the growth funnel, a growth loop continuously adds to create more output and revenue. The more output that is reinvested by the user or player, the larger the output created from the next cycle. This compounding is critical as rather than creating a multitude of growth loops, you want to measure and focus on the ones that have the greatest impact.

As growth loops are holistic systems, they are also more defensible than growth funnel. In a funnel, any element of the funnel can be attacked. Growth loops, however, integrate product, channel and monetization model specific to your game and thus harder for other companies to copy.

Why loops are better

Balfour explains that growth loops change your entire business, largely for the better. The key benefits include:

  • You get away from siloes (product, marketing, etc) and work together. Growth loops force companies to build a system.
  • You invest resources in systems that are more sustainable long-term, that continue to grow on their own.
  • You organize your personnel and teams towards a common goal, aligning and optimizing the growth loops.

Next steps

When building your company and designing your games or products, think holistically. Understand how you will create growth loops that will feed themselves and build a long-term dominant product. With games, ensure that there are loops in the game that drive the acquisition phase.

Key takeaways

  • Growth loops represent the evolution from a traditional acquisition funnel to a loop that continually creates value. Loops are closed systems where the inputs through some process generates more of an output that can be reinvested in the input.
  • Rather than creating siloes, growth loops help marketing, product, monetization, analytics work holistically.
  • A key value derived from growth loops is they have a compounding effect, they continually add value to the initial investment and thus perpetually grow the underlying product.
  • Share this:

    • Facebook
    • LinkedIn

    Like this:

    Like Loading...
General Social Games Business General Tech Business Growth Social Games Marketingfunnel Growth
3 Comments

Highlights from ICE 2019

by Lloyd MelnickFebruary 7, 2019

After spending three days at ICE, the largest B2B iGaming show in the world, I wanted to share some of the highlights. While there was nothing dramatically different this year, it reinforced several trends:

There are many red oceans

I have written many times about blue oceans and red oceans, the former being spaces in the market where your competitors are irrelevant, the latter where you are competing directly with others. In the iGaming space, there is very little creativity and almost all the companies are just trying to be a little better than their competitors. There are a few silos in the industry, and within each silo the companies are largely interchangeable. Virtually all the companies, large and small, are imitating each other and adding minor twists around the fringes. The concern with this situation is that in a red ocean it is very challenging to maintain your margins and generate long-term growth.

Content as a commodity

The iGaming industry is evolving to a position where content is becoming a commodity, in part driven by the red ocean mentality. Technology and globalization is also contributing to this situation, as the barriers to entry are exceedingly low for content development. A good artist and designer anywhere — Chicago, Bangalore, Vilnius or Jakarta — can create a beautiful slot. While math is critical, there are many great mathematicians who can make the beautiful slot into a decent game. Not only does good content flood the market, it allows operators to create their own content cost effectively and skim a large part of their revenue into machines that do not generate third party royalties.

While this problem runs counter to the concept that content is king, content is not king if it is virtually the same. Content that stands out still enjoys premium pricing and attracts more players and operators. Great content cannot be replaced with quickly made internal product. Very little content, though, falls into this bucket and most is competing for an increasingly small revenue pool.

While this situation is bad news for content creators, it is great for operators. The plethora of slot providers puts the basic supply and demand formula in favor of operators. They can negotiate more favorable royalty deals or build their own competitive machines with minimal cost.

Platforms offering zero value

Consistent with the glut of content is a glut of platforms and aggregators. In the video game space, there are many “publishers” who will license a game, take a share (sometimes very significant) and just submit the game to the AppStores, adding virtually zero value.

In the iGaming space, many people have created platforms where they aggregate slots content and distribute it to operators. The problem is that many of these platforms or aggregators have few relationships with operators, and even the operators who have integrated them put the content in the back of the virtual store. There were many stories at ICE of slots developers who have generated dollars or only cents from an integration with a platform. Just as in the video gaming space, content providers need to do their due diligence before selecting a platform.

Lots of people speaking American

For many years, G2E has been the gambling show that Americans went to while ICE was largely for Europeans, but I heard many American accents this year. Additionally, some traditionally US focused companies — Everi, AGS, Scientific Games, etc. — had large presences at ICE. It shows the US companies, particularly content providers, understand that the online real money market (which is dominated by Europeans) dwarfs the US land based market. Europe provides a great opportunity for many of these companies, though it also means more content on the market.

Not everyone got the memo about crypto

While the bloom is off the crypto rose almost everywhere, particularly tech, many iGaming companies are still operating on the momentum it had twelve months ago. Throw the word crypto on a mediocre offering and expect it to be worth an order of magnitude more. This approach is consistent with how the industry reacts and copies rather than seeks blue oceans, so I am confident that next year there will be very little crypto left and they will be chasing the next one year old trend.

The promise of virtual sports

Not all the news is bad. The quality and breadth of the virtual sports offerings is very impressive. Walking through the virtuals area was like being at a sports bar with multiple TVs showing live events. The rendered virtual sports are often better than games available for console, like Madden or FIFA. There are also some great offerings that put together video clips of live events and create a virtual event. I expect virtual sports to be a big growth area online (both real money and social) in the next few years.

Highlight-

Key takeaways

  • At ICE this year, there was little new and many companies copying each other, competing in a red ocean.
  • There is a glut of slots content, driving down revenue for slots providers but potentially providing a cost savings for operators.
  • Virtual sports represents the best opportunity for growth, as the quality of the content is improving exponentially.

Share this:

  • Facebook
  • LinkedIn

Like this:

Like Loading...
General Social Games Business Social Casinocontent ICE slots Virtual Sports
1 Comment

Lifetime Value Part 26: My most valuable retention KPIs

by Lloyd MelnickFebruary 5, 2019January 4, 2019

I have written many times about customer lifetime value (LTV)and how it is the critical determinant of a company’s success (any company, from mobile games to retailers). A user’s lifetime value has to exceed the cost of acquiring the customer, otherwise companies cannot grow and will eventually die.

Last year, I discussed that out of the three key components of LTV – monetization, virality and retention – retention was the one most critical for success. While people sometimes focus on monetization, its impact on the long-term value of a customer is limited. Think of a retail store. Would they rather have a customer who comes in, makes a $100 purchase but never returns or somebody who comes in every week and makes a purchase ranging from $10 to $25? Obviously, they would prefer the latter. Successful businesses, games, apps, have great retention, thus creating high LTVs and allowing for more marketing spend.

While the mathematical case for focusing on retention is incontrovertible, many companies have not perfected how to measure retention effectively. Most social game companies, among the most sophisticated users of analytics, rely on measuring retention by D1/D7/D30 retention (how many players who installed on Day 0 are play after one day, seven days and thirty days, respectively). While this method is an acceptable (and sometimes powerful) way of tracking how new users are performing, even D30 retention only reflects behavior of customers acquired in the last month. It does not show how well the game or company is retaining its existing customer base.

When I was at Zynga, I came across a metric that perfectly captures how well you are performing with your existing customers, CURR (current user return rate). CURR is complemented by NURR (new user return rate) and RURR (returning user return rate). Since leaving Zynga, not only have I taken these KPIs with me, I have used them as a key focus for optimizing products. A post by Nathan Williams, SaaS Retention Metrics: Lessons from Free-to-Play Games, reminded me how important these KPIs are and how to best use them.

urr retention chart

CURR

CURR (current user return rate) is the most important KPI to track (or at least a tie with NPS). It shows how loyal your existing customers are; you should consider CURR the inverse of churn. If your CURR increases, it means you have improved your product’s appeal to existing players or customers, if CURR declines you have made your game worse. CURR is also an excellent way of looking at how your game is performing among different segments, VIPs versus payers versus never-spenders.

To calculate CURR, you start with all the users who played the game between t-14 (14 days before today, today minus 14) and t-20 and who used the product between t-7 and t-13, what percentage returned to play between t-0 and t-6. The benchmark for a good, but not great, game is 80 percent.

NURR

NURR (new user return rate) is a great metric for understanding how appealing your game is to players you have just acquired. A low NURR shows you have a bad initial experience (or a bad traffic source), turning off many users. It is virtually impossible to acquire players profitably with a low NURR.

To calculate NURR, take all the players who used the game for the first time between t-7 and t-13 and look at what percentage returned to the game between t-0 and t-6. You can benchmark NURR at about 30 percent, though it is dependent on the type of game and platform. There is much higher variance in NURR than CURR among successful games (a game on desktop could succeed with a much lower NURR than a game on Google Play).

RURR

RURR (return user return rate) shows how many people who had churned and returned to your game stay active. It is a great way of measuring how well your game can capitalize on CRM and paid reactivation campaigns. If the number is low, you are doing a great job of bringing players back but the product is still not compelling to these players.

You can calculate RURR by taking all the players who were active at some point but did not use the product between t-14 and t-20, and did use the product between t-7 and t-13, what percentage returned to play the game between t-0 and t-6. There is also significant variance in this benchmark but I usually target 40 percent for social casino games.

slide1

Use *URR to track product performance

Once you start monitoring CURR/RURR/NURR, you should use them to understand what is working and where there are issues. If you see a significant change in CURR, it is almost certainly caused by recent product changes. Low NURR indicates either you have broken your FTUE or you have added weak sources of traffic. A low RURR indicates your CRM or reactivation team is doing a good job but you need to add product features to keep the players you are brining back.

Key takeaways

  1. Retention is the key driver of customer lifetime value (LTV), and CURR/NURR/RURR are the most accurate metrics to track retention.
  2. CURR (current user return rate) is your most valuable metric, the percent of your current players who are staying active. It shows whether changes in your product are appealing to or deterring your player base.
  3. NURR (new user return rate) shows if your initial user experience is strong while RURR (return user return rate) shows if your game is appealing to players who have churned but decide to try it again.

Share this:

  • Facebook
  • LinkedIn

Like this:

Like Loading...
Analytics General Social Games Business General Tech Business Growth Lloyd's favorite posts LTV Social Casinoanalytics curr LTV retention
4 Comments
  • Home
  • About

Get my book on LTV

The definitive book on customer lifetime value, Understanding the Predictable, is now available in both print and Kindle formats on Amazon.

Understanding the Predictable delves into the world of Customer Lifetime Value (LTV), a metric that shows how much each customer is worth to your business. By understanding this metric, you can predict how changes to your product will impact the value of each customer. You will also learn how to apply this simple yet powerful method of predictive analytics to optimize your marketing and user acquisition.

For more information, click here

Follow The Business of Social Games and Casino on WordPress.com

Enter your email address to follow this blog and receive notifications of new posts by email.

Join 1,373 other followers

Most Recent Posts

  • Podcasts now available
  • Lessons for gaming and tech companies from the Peter Drucker Forum
  • Chaos Theory, the Butterfly Effect, and Gaming
  • How to give help without micromanaging

Lloyd Melnick

This is Lloyd Melnick’s personal blog.  All views and opinions expressed on this website are mine alone and do not represent those of people, institutions or organizations that I may or may not be associated with in professional or personal capacity.

I am a serial builder of businesses (senior leadership on three exits worth over $700 million), successful in big (Disney, Stars Group/PokerStars, Zynga) and small companies (Merscom, Spooky Cool Labs) with over 20 years experience in the gaming and casino space.  Currently, I am the GM of VGW’s Chumba Casino and on the Board of Directors of Murka Games and Luckbox.

Topic Areas

  • Analytics (114)
  • Bayes' Theorem (8)
  • behavioral economics (8)
  • blue ocean strategy (14)
  • Crowdfunding (4)
  • General Social Games Business (457)
  • General Tech Business (194)
  • Growth (88)
  • International Issues with Social Games (50)
  • Lloyd's favorite posts (101)
  • LTV (54)
  • Machine Learning (10)
  • Mobile Platforms (37)
  • Social Casino (51)
  • Social Games Marketing (104)
  • thinking fast and slow (5)
  • Uncategorized (32)

Social

  • View CasualGame’s profile on Facebook
  • View @lloydmelnick’s profile on Twitter
  • View lloydmelnick’s profile on LinkedIn

RSS

RSS Feed RSS - Posts

RSS Feed RSS - Comments

Categories

  • Analytics (114)
  • Bayes' Theorem (8)
  • behavioral economics (8)
  • blue ocean strategy (14)
  • Crowdfunding (4)
  • General Social Games Business (457)
  • General Tech Business (194)
  • Growth (88)
  • International Issues with Social Games (50)
  • Lloyd's favorite posts (101)
  • LTV (54)
  • Machine Learning (10)
  • Mobile Platforms (37)
  • Social Casino (51)
  • Social Games Marketing (104)
  • thinking fast and slow (5)
  • Uncategorized (32)

Archives

  • March 2021
  • February 2021
  • January 2021
  • December 2020
  • November 2020
  • October 2020
  • September 2020
  • August 2020
  • July 2020
  • June 2020
  • May 2020
  • April 2020
  • March 2020
  • February 2020
  • January 2020
  • November 2019
  • October 2019
  • September 2019
  • June 2019
  • May 2019
  • April 2019
  • March 2019
  • February 2019
  • January 2019
  • December 2018
  • June 2018
  • May 2018
  • April 2018
  • March 2018
  • February 2018
  • January 2018
  • December 2017
  • June 2017
  • May 2017
  • April 2017
  • March 2017
  • February 2017
  • January 2017
  • December 2016
  • November 2016
  • October 2016
  • September 2016
  • June 2016
  • May 2016
  • April 2016
  • March 2016
  • February 2016
  • January 2016
  • December 2015
  • November 2015
  • October 2015
  • September 2015
  • July 2015
  • June 2015
  • May 2015
  • April 2015
  • March 2015
  • February 2015
  • January 2015
  • December 2014
  • November 2014
  • October 2014
  • September 2014
  • August 2014
  • July 2014
  • June 2014
  • May 2014
  • April 2014
  • March 2014
  • February 2014
  • January 2014
  • December 2013
  • November 2013
  • October 2013
  • September 2013
  • August 2013
  • July 2013
  • June 2013
  • May 2013
  • April 2013
  • March 2013
  • February 2013
  • January 2013
  • December 2012
  • November 2012
  • October 2012
  • September 2012
  • August 2012
  • July 2012
  • June 2012
  • May 2012
  • April 2012
  • March 2012
  • February 2012
  • January 2012
  • December 2011
  • November 2011
  • October 2011
  • September 2011
  • August 2011
  • July 2011
  • June 2011
  • May 2011
  • December 2010
February 2019
S M T W T F S
 12
3456789
10111213141516
17181920212223
2425262728  
« Jan   Mar »

by Lloyd Melnick

All posts by Lloyd Melnick unless specified otherwise
Google+

Enter your email address to subscribe to this blog and receive notifications of new posts by email.

Join 1,373 other followers

Follow Lloyd Melnick on Quora

RSS HBR Blog

  • What Went Wrong with the Boeing 737 Max?
    Harvard Business School professor Bill George examines the Boeing 737 Max crashes through the lens of industry and corporate culture.
  • Partnering with a Technology Consultancy Can Help Scale Your Digital Transformation - SPONSOR CONTENT FROM WWT
    Sponsor content from WWT.

RSS Techcrunch

  • An error has occurred; the feed is probably down. Try again later.

RSS MIT Sloan Management Review Blog

  • Why Less Is More in Data Migration
    As the pandemic continues, companies are racing to transfer data from old, bloated IT systems to more nimble, modern setups in order to launch new online services and maintain operating systems remotely. But few of these large-scale initiatives proceed as planned or deliver promised results. Many multiyear IT data migration programs fail — often at […]
  • The Best of This Week
    With Remote Collaboration, Sometimes Conflict Is a Good Thing Remote work environments lack the spontaneous exchange of ideas that can naturally occur in an in-office setting. To spur innovation in this challenging context, leaders have to be skillful in connecting with employees at all levels of the organization while encouraging rigorous debate. Why Good L […]
Website Powered by WordPress.com.
Cancel

 
Loading Comments...
Comment
    ×
    <span>%d</span> bloggers like this: