Skip to content

The Business of Social Games and Casino

How to succeed in the mobile game space by Lloyd Melnick

Tag: curr

Lifetime Value Part 26: My most valuable retention KPIs

Lifetime Value Part 26:  My most valuable retention KPIs

I have written many times about customer lifetime value (LTV)and how it is the critical determinant of a company’s success (any company, from mobile games to retailers). A user’s lifetime value has to exceed the cost of acquiring the customer, otherwise companies cannot grow and will eventually die.

Last year, I discussed that out of the three key components of LTV – monetization, virality and retention – retention was the one most critical for success. While people sometimes focus on monetization, its impact on the long-term value of a customer is limited. Think of a retail store. Would they rather have a customer who comes in, makes a $100 purchase but never returns or somebody who comes in every week and makes a purchase ranging from $10 to $25? Obviously, they would prefer the latter. Successful businesses, games, apps, have great retention, thus creating high LTVs and allowing for more marketing spend.

While the mathematical case for focusing on retention is incontrovertible, many companies have not perfected how to measure retention effectively. Most social game companies, among the most sophisticated users of analytics, rely on measuring retention by D1/D7/D30 retention (how many players who installed on Day 0 are play after one day, seven days and thirty days, respectively). While this method is an acceptable (and sometimes powerful) way of tracking how new users are performing, even D30 retention only reflects behavior of customers acquired in the last month. It does not show how well the game or company is retaining its existing customer base.

When I was at Zynga, I came across a metric that perfectly captures how well you are performing with your existing customers, CURR (current user return rate). CURR is complemented by NURR (new user return rate) and RURR (returning user return rate). Since leaving Zynga, not only have I taken these KPIs with me, I have used them as a key focus for optimizing products. A post by Nathan Williams, SaaS Retention Metrics: Lessons from Free-to-Play Games, reminded me how important these KPIs are and how to best use them.

urr retention chart

CURR

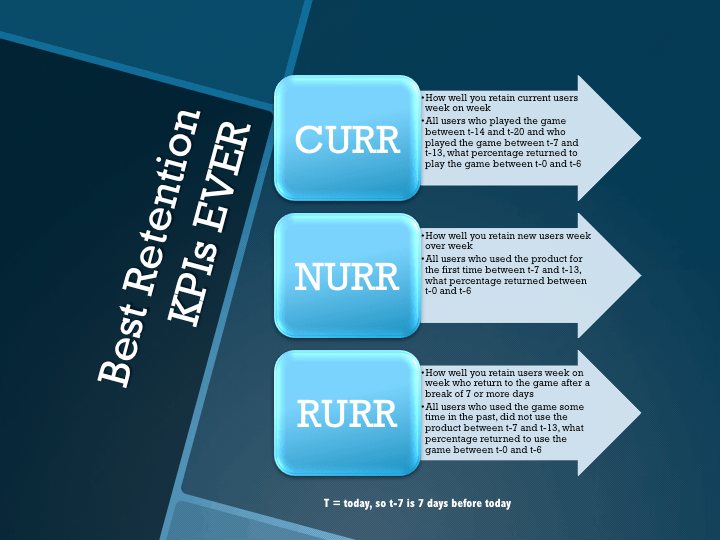
CURR (current user return rate) is the most important KPI to track (or at least a tie with NPS). It shows how loyal your existing customers are; you should consider CURR the inverse of churn. If your CURR increases, it means you have improved your product’s appeal to existing players or customers, if CURR declines you have made your game worse. CURR is also an excellent way of looking at how your game is performing among different segments, VIPs versus payers versus never-spenders.

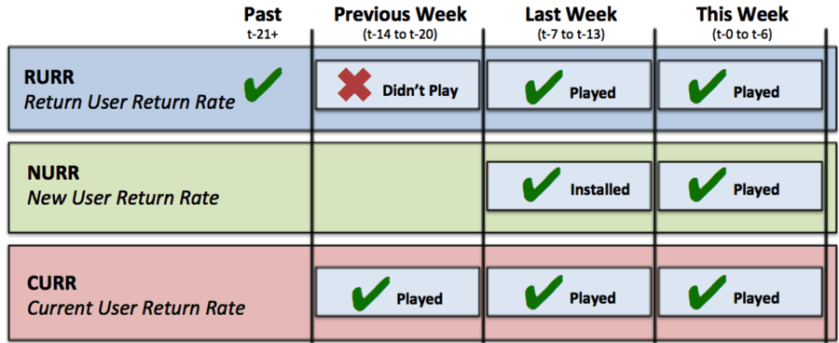
To calculate CURR, you start with all the users who played the game between t-14 (14 days before today, today minus 14) and t-20 and who used the product between t-7 and t-13, what percentage returned to play between t-0 and t-6. The benchmark for a good, but not great, game is 80 percent.

NURR

NURR (new user return rate) is a great metric for understanding how appealing your game is to players you have just acquired. A low NURR shows you have a bad initial experience (or a bad traffic source), turning off many users. It is virtually impossible to acquire players profitably with a low NURR.

To calculate NURR, take all the players who used the game for the first time between t-7 and t-13 and look at what percentage returned to the game between t-0 and t-6. You can benchmark NURR at about 30 percent, though it is dependent on the type of game and platform. There is much higher variance in NURR than CURR among successful games (a game on desktop could succeed with a much lower NURR than a game on Google Play).

RURR

RURR (return user return rate) shows how many people who had churned and returned to your game stay active. It is a great way of measuring how well your game can capitalize on CRM and paid reactivation campaigns. If the number is low, you are doing a great job of bringing players back but the product is still not compelling to these players.

You can calculate RURR by taking all the players who were active at some point but did not use the product between t-14 and t-20, and did use the product between t-7 and t-13, what percentage returned to play the game between t-0 and t-6. There is also significant variance in this benchmark but I usually target 40 percent for social casino games.

slide1

Use *URR to track product performance

Once you start monitoring CURR/RURR/NURR, you should use them to understand what is working and where there are issues. If you see a significant change in CURR, it is almost certainly caused by recent product changes. Low NURR indicates either you have broken your FTUE or you have added weak sources of traffic. A low RURR indicates your CRM or reactivation team is doing a good job but you need to add product features to keep the players you are brining back.

Key takeaways

  1. Retention is the key driver of customer lifetime value (LTV), and CURR/NURR/RURR are the most accurate metrics to track retention.
  2. CURR (current user return rate) is your most valuable metric, the percent of your current players who are staying active. It shows whether changes in your product are appealing to or deterring your player base.
  3. NURR (new user return rate) shows if your initial user experience is strong while RURR (return user return rate) shows if your game is appealing to players who have churned but decide to try it again.

Like this:

Like Loading...
Author Lloyd MelnickPosted on February 5, 2019January 4, 2019Categories Analytics, General Social Games Business, General Tech Business, Growth, Lloyd's favorite posts, LTV, Social CasinoTags analytics, curr, LTV, retention1 Comment on Lifetime Value Part 26: My most valuable retention KPIs

Get my book on LTV

The definitive book on customer lifetime value, Understanding the Predictable, is now available in both print and Kindle formats on Amazon.

Understanding the Predictable delves into the world of Customer Lifetime Value (LTV), a metric that shows how much each customer is worth to your business. By understanding this metric, you can predict how changes to your product will impact the value of each customer. You will also learn how to apply this simple yet powerful method of predictive analytics to optimize your marketing and user acquisition.

For more information, click here

Follow The Business of Social Games and Casino on WordPress.com

Enter your email address to follow this blog and receive notifications of new posts by email.

Join 950 other followers

Lloyd Melnick

This is Lloyd Melnick’s personal blog. I am Director of StarsPlay at The Stars Group (PokerStars), where I lead the team responsible for free-to-play gaming. I am a serial builder of businesses (senior leadership on three exits worth over $700 million), successful in big (Disney, Stars Group, Zynga) and small companies (Merscom, Spooky Cool Labs) with over 20 years experience in the gaming and casino space.

Topic Areas

  • Analytics (89)
  • Bayes' Theorem (7)
  • Crowdfunding (4)
  • General Social Games Business (387)
  • General Tech Business (142)
  • Growth (79)
  • International Issues with Social Games (49)
  • Lloyd's favorite posts (84)
  • LTV (47)
  • Machine Learning (10)
  • Mobile Platforms (37)
  • Social Casino (24)
  • Social Games Marketing (91)
  • thinking fast and slow (5)
  • Uncategorized (31)

Social

  • View CasualGame’s profile on Facebook
  • View @lloydmelnick’s profile on Twitter
  • View lloydmelnick’s profile on LinkedIn

Enter your email address to subscribe to this blog and receive notifications of new posts by email.

Join 950 other followers

Archives

  • February 2019
  • January 2019
  • December 2018
  • June 2018
  • May 2018
  • April 2018
  • March 2018
  • February 2018
  • January 2018
  • December 2017
  • June 2017
  • May 2017
  • April 2017
  • March 2017
  • February 2017
  • January 2017
  • December 2016
  • November 2016
  • October 2016
  • September 2016
  • June 2016
  • May 2016
  • April 2016
  • March 2016
  • February 2016
  • January 2016
  • December 2015
  • November 2015
  • October 2015
  • September 2015
  • July 2015
  • June 2015
  • May 2015
  • April 2015
  • March 2015
  • February 2015
  • January 2015
  • December 2014
  • November 2014
  • October 2014
  • September 2014
  • August 2014
  • July 2014
  • June 2014
  • May 2014
  • April 2014
  • March 2014
  • February 2014
  • January 2014
  • December 2013
  • November 2013
  • October 2013
  • September 2013
  • August 2013
  • July 2013
  • June 2013
  • May 2013
  • April 2013
  • March 2013
  • February 2013
  • January 2013
  • December 2012
  • November 2012
  • October 2012
  • September 2012
  • August 2012
  • July 2012
  • June 2012
  • May 2012
  • April 2012
  • March 2012
  • February 2012
  • January 2012
  • December 2011
  • November 2011
  • October 2011
  • September 2011
  • August 2011
  • July 2011
  • June 2011
  • May 2011
  • December 2010

Most Recent Posts

  • Think of Non-Customers First If You Want to Grow
  • Creating growth loops to scale your game
  • Highlights from ICE 2019
  • Lifetime Value Part 26: My most valuable retention KPIs

RSS

RSS Feed RSS - Posts

RSS Feed RSS - Comments

February 2019
S M T W T F S
« Jan    
 12
3456789
10111213141516
17181920212223
2425262728  

Categories

  • Analytics (89)
  • Bayes' Theorem (7)
  • Crowdfunding (4)
  • General Social Games Business (387)
  • General Tech Business (142)
  • Growth (79)
  • International Issues with Social Games (49)
  • Lloyd's favorite posts (84)
  • LTV (47)
  • Machine Learning (10)
  • Mobile Platforms (37)
  • Social Casino (24)
  • Social Games Marketing (91)
  • thinking fast and slow (5)
  • Uncategorized (31)

Archives

  • February 2019
  • January 2019
  • December 2018
  • June 2018
  • May 2018
  • April 2018
  • March 2018
  • February 2018
  • January 2018
  • December 2017
  • June 2017
  • May 2017
  • April 2017
  • March 2017
  • February 2017
  • January 2017
  • December 2016
  • November 2016
  • October 2016
  • September 2016
  • June 2016
  • May 2016
  • April 2016
  • March 2016
  • February 2016
  • January 2016
  • December 2015
  • November 2015
  • October 2015
  • September 2015
  • July 2015
  • June 2015
  • May 2015
  • April 2015
  • March 2015
  • February 2015
  • January 2015
  • December 2014
  • November 2014
  • October 2014
  • September 2014
  • August 2014
  • July 2014
  • June 2014
  • May 2014
  • April 2014
  • March 2014
  • February 2014
  • January 2014
  • December 2013
  • November 2013
  • October 2013
  • September 2013
  • August 2013
  • July 2013
  • June 2013
  • May 2013
  • April 2013
  • March 2013
  • February 2013
  • January 2013
  • December 2012
  • November 2012
  • October 2012
  • September 2012
  • August 2012
  • July 2012
  • June 2012
  • May 2012
  • April 2012
  • March 2012
  • February 2012
  • January 2012
  • December 2011
  • November 2011
  • October 2011
  • September 2011
  • August 2011
  • July 2011
  • June 2011
  • May 2011
  • December 2010

by Lloyd Melnick

All posts by Lloyd Melnick unless specified otherwise
The Business of Social Games and Casino Powered by WordPress.com.
Cancel
%d bloggers like this: