Skip to content

The Business of Social Games and Casino

How to succeed in the mobile game space by Lloyd Melnick

Category: General Social Games Business

People Analytics for Online Gaming

People Analytics for Online Gaming

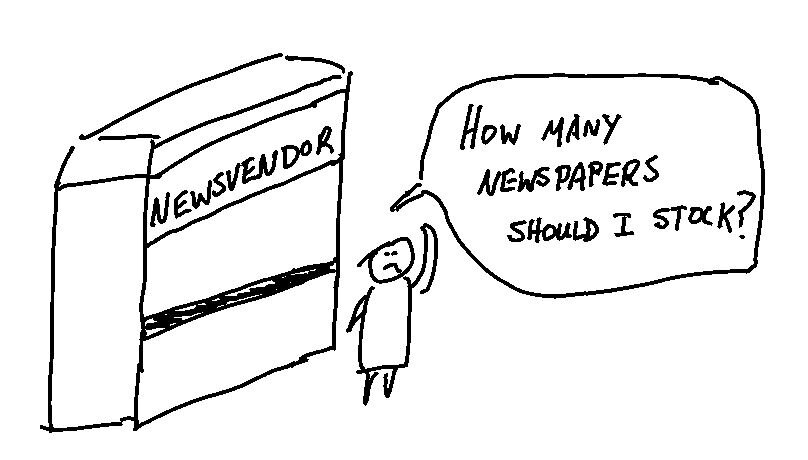
Last month, I wrote about some applications online gaming companies can take from the world of operations analytics, which are primarily used by traditional and retail businesses, and a course on People Analytics from Wharton showed some ways this area of analytics could be used to improve our businesses. While people analytics is often the domain of HR professionals, there are valuable elements for managers across tech businesses (many of whom do not have robust HR teams). Below are some of the most important takeaways from the course.

Identifying the noise and improving performance evaluations

A critical role for any leader or manager is accurately evaluating performance of your employees. Accuracy is important to ensure you provide useful feedback that helps people improve, assists you in putting the right people in the correct roles and identifies the skills needed for success in specific functions.

The fundamental challenge in performance evaluation is that performance measures are very noisy. There is a range of outcomes possible outside of the employee’s control. The challenge is separating skill and effort from luck so that you understand true performance.

In the course, the instructors highlight how often people confuse skill with luck. They start with an example from sports, showing that professional American football teams ability to draft (select out of university) players is almost primarily luck. While some teams have had a string of success, success in one year has no predictive ability on success in future years. If skill were a key factor, then you would expect a team to repeat its success.

It also holds true with investment analysts. An analyst who has a great year is no more likely to have above market results the next year than one of the poorest performing analysts.

There are many reasons we confuse this luck with skill:

  • Interdependence. I have found a humbling amount of work depends on other people, if they are great we look great, if they are not, we look bad. You should not attribute individual performance to something that is at the group level. In these cases, performance should be evaluated as a group. Conversely, reliable individual evaluation requires seeing people on other teams (for example, Tom Brady’s play on the Buccaneers will help assess whether his performance was due to him or the environment).
  • Outcome bias. We tend to believe good things happen to those who work hard and judge by outcome, not by process.
  • Reverse causality. When we see two correlated factors, we tend to believe one caused the other. In reality, one there may be no causality or it may be in the other direction. This leads us to see things that do not exist and can prompt us to give people undeserved credit or blame. One example cited in the course was research that showed charisma did not impact whether a CEO was successful, but successful leaders were considered more charismatic.
  • Narrative seeking. We want to make sense of the world and tell a causal story.
  • Hindsight bias. Once we have seen something occur, it is hard to anticipate we did not see it coming. We rewrite the history in our minds the history of the process.
  • Context. We tend to neglect context when evaluating performance. We over attribute performance to personal skills and under attribute it to environmental factors such as the challenge of the problem the employee faced, quality of their team, etc. In psychology, this issue is referred to as the Fundamental Attribution Error, blaming or crediting personality traits to situational traits.
  • Self-fulfilling prophesies. People tend toward performing consistent with expectations. High expectations increase performance, low expectations decrease performance
  • Small samples. Small samples lead to greater variation, what we see in a small sample may not be representative of a large population.
  • Omitted variable bias. There could be an additional reason that is driving both what the performance and what we think is causing the performance. For example, we may think higher compensation is leading to better performance. The truth might be that extra effort is causing both higher compensation and superior performance, thus the key variable (effort) had been omitted.

When you are looking at evaluating performance, there are several tools to improve your accuracy. You need to focus on the process the employee (or potential employee) took rather than only the outcome; we normally omit almost 50 percent of the objectives that we later identify as relevant to success. Thus, you should look at a much broader set of objectives that impact the business. This process includes determining what increases the likelihood for superior performance, rather than traditional outcomes are there four or five things that may not be obvious but contribute to overall success. A few years ago, I wrote how one basketball player (Shane Battier) was much more valuable than many players who scored more points or otherwise had flashier statistics, the same holds true in traditional business.

You need to look carefully at the job and understand what drives success. Define success not only by outcomes but how well these factors predict other KPIs, attrition, rate of promotion, etc. In the course, they also point out what works for one role or company does not necessarily work for others. Google found that GPA was an awful predictor of performance, but for Goldman Sachs it is the gold standard of who will be successful.

Slide1

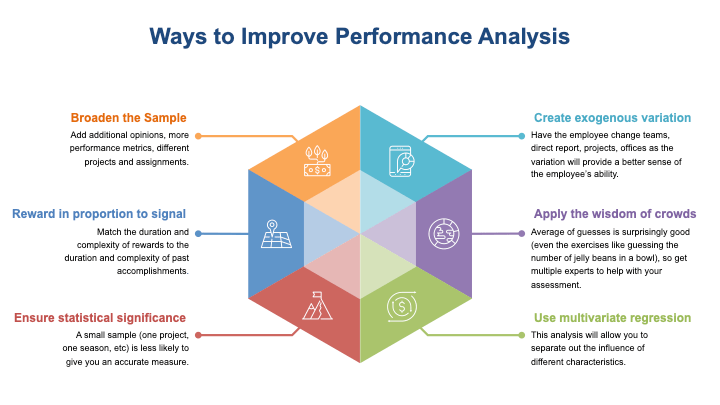
Additional ways to improve performance evaluation include:

  • Broaden the sample. Add additional opinions, more performance metrics, different projects and assignments. The key is to use diverse, uncorrelated signals.
  • Find and create exogenous variation. The only truly valid way to tease out causation is to control an employee’s environment. Have the employee change teams, direct report, projects, offices as the variation will provide a better sense of the employee’s ability.
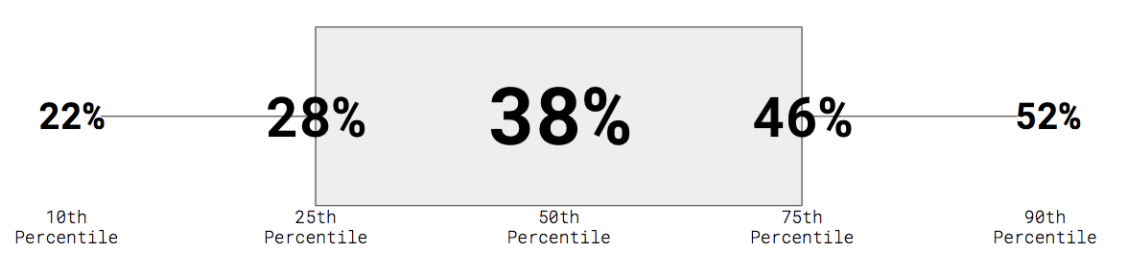
  • Reward in proportion to the signal. Match the duration and complexity of rewards to the duration and complexity of past accomplishments. For short, noisy signals it is better to give bonuses and praise rather than raises and promotions.
  • The wisdom of crowds. Average of guesses is surprisingly good (even the exercises like guessing the number of jelly beans in a bowl), so get multiple experts to help with your assessment. Ensure, though, that their predictions are independent of each other (they are not talking to each other, they do not have the same background, etc).
  • Ensure statistical significance. A small sample (one project, one season, etc) is less likely to give you an accurate measure.
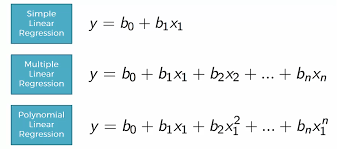
  • Use multivariate regression. This analysis will allow you to separate out the influence of different characteristics.

At the end of the day, you need to separate the signal from the noise to evaluate current performance and predict future success. Someone may have had a great performance or year but they may be a less valuable future employee than someone else because of luck or other environmental factors.

Recruiting the right people

Evaluating performance is not only important for your current team but also recruiting the best new hires. Hiring the wrong person can have huge consequences, including missed growth opportunities, damaging your culture and decreased output. Yet, most companies find consistently recruiting the right people difficult. This is often caused by the Illusion of Validity, that we think we know more about people than we actually do. We interview somebody and believe we can judge his or her suitability for a job. This Illusion is popped by research that shows the correlation of several hiring tools to subsequent performance (Ranked from most effective to worst:

  1. Work samples.
  2. Cognitive ability tests (these are general intelligence tests).
  3. Structured interviews.
  4. Job knowledge tests.
  5. Integrity tests.
  6. Unstructured interviews.
  7. Personality tests.
  8. Reference checks.

Several of the low scoring tools reinforce the Illusion of Validity. Unstructured interviews, where you meet someone and get a sense of their strengths and weaknesses, is often the paramount driver for whether we hire a candidate, but we are not good judges of character. I remember reading when President Bush first met Russian President Putin in 2001, he said “I looked the man in the eye. I found him to be very straight forward and trustworthy.” We see how well that worked out. As the above research also shows, reference checks are even more ineffective in the hiring process for similar reasons.

What does work is seeing examples of their previous relevant work, intelligence tests and structured interviews. Structured interviews are one designed to assess specific attributes of a candidate.

Use analysis for internal promotions

As well as improving the hiring process, People Analytics can help move the right people internally into the right roles. Often, people are promoted based on having done a great job in their current role. The course shows, though, that this approach often leads to negative outcomes (both for the employee and the company). The skills needed to succeed in the next job may not be the same skills that led to success in the current job. Performance in one job is not automatically a predictor of performance in a new role.

Just as it is important to understand the key predictors of success when recruiting, you need to do the same with internal promotion. Understand what leads to success in the new role and hire internally (or externally) those most likely to succeed. The good news is that research has shown that people promoted performed better overall than new hires into comparable roles.

Reducing employee churn

Attrition is one of the costliest problems company’s face and People Analytics can help combat this problem. The expense of losing an employee includes hiring a replacement, training costs, loss of critical knowledge and the impact on customer relationships. People analytics offers help in mitigating this problem. You should start by analyzing the percent turnover at specific milestones (3 months, 6 months, 1 year, etc.) and evolve into using multivariate regressions to predict who will reach each milestone. As you get more sophisticated you can build a survival model to understand over time what proportion will stay with your company. And then finally look at a survival/hazard rate model to test what factors accelerate the risk of exit.

During the course, they also provided some interesting data on why people leave. The decision to quit is most commonly driven by external factors, comparing the current job to a new opportunity. This understanding is critical as internal factors do play a role, internal issues still have a relatively small relationship to how likely people are to churn.

To reduce churn over time, the instructors of the course suggest an informed hiring strategy (where predicting churn is integrating into who is hired) and target interventions (reduce factors that accelerate risk of exit, address unmet needs, focus retention efforts, etc).

Using network analysis to improve collaboration

Another great takeaway from the course was how to use network analysis to understand, improve and incentive collaboration. Without getting too granular, network analysis involves looking at the informal links between employees, who gets information from who and what direction(s) that information is flowing. Once you draw that map, you can understand who are central to communications, who are outside the map, areas for improvement and people who should be rewarded for their role in collaboration.

network map

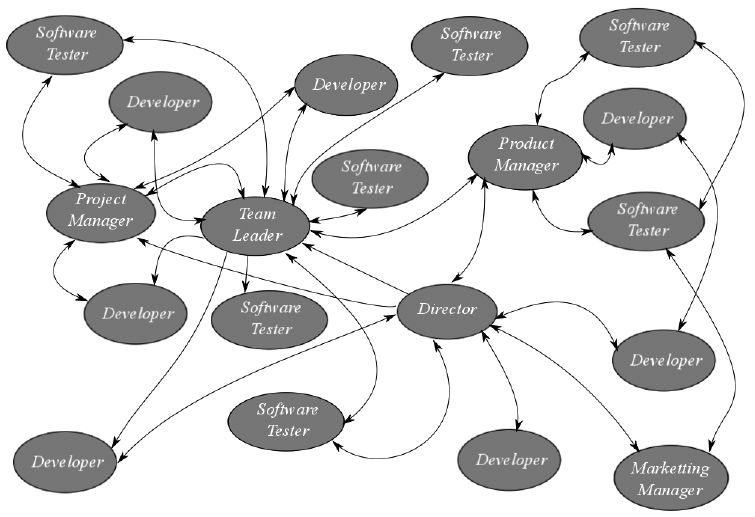
While there are many details to creating and analyzing a network, there are five key areas to focus on when looking at individuals (there are no right and wrong answers for each attribute, optimizing depends on the goal and environment):

  1. Network size. How many people are they connected to.
  2. Network strength. How important and often are the lines of communication.
  3. Network range. How many different groups are they connected to. Range would be small if you are connected to everyone on your team even if it is a big team, large if you are connected to one person at every other corporate function (i.e. marketing, accounting, analytics, etc.)
  4. Network density. Are the connections connected to different people or to each other.
  5. Network centrality. Is everyone equally central or are there some in the middle and others on the fringes.

Understand how your company’s network works will allow you to understand collaboration patterns. For example, by deconstructing performance, you can understand if collaboration patterns impact performance. If there is a positive causal relationship, you can work to replicate or improve these relationships. If there is no relationship, your team might be wasting time on unnecessary collaboration.

You can use this analysis to understand if collaboration is needed and where. Then you can strategically build ties and bridges between different parts of the organization. This result can be achieved with:

  • Cross-functional meetings.
  • Conference calls or video conferences
  • Job rotations
  • Site visits
  • Events

You should also identify where collaboration is unnecessary or overly burdensome and reduce demands on people. Match overloaded people with well-regarded employees who are under-utilized, who can relieve some of the burden. Also identify a small number of new connections that would have the biggest positive impact on team connectivity and shift responsibilities more evenly across members.

Tying performance evaluation with collaboration

People analytics can be particularly helpful connecting the performance evaluation methods discussed above with analysis of collaboration. As I wrote earlier, the key to good performance reviews is understanding what drives the outcomes you are looking for. If collaboration is one of those success drivers, you need to evaluate it thoroughly and incorporate into performance reviews and internal promotions (you do not want to promote someone weak at collaboration into a role where it is vital to success).

You should revise your evaluation systems to include collaboration. First, this will provide incentive to employees to build and use meaningful relationships. Second, it will recognize team members who help others win new clients or serve current customers, even if those direct results accrue to someone else (the basketball player who passes the ball rather than dunks).

To achieve this goal, you need to have the right measures. If you are assessing individual collaboration, you need to look at elements the individual controls. You then need to make sure there is reliability, which are the assessments will remain consistent over time and across raters. Third, the measures must have validity (accuracy). There also needs to be comparability, you need to be able to use the measures to look at all people who you are evaluating. Finally, it must be cost effective, it should not be too expensive to collect the information.

Key takeaways

  • You need to align performance evaluations with the underlying factors that create success; deconstruct what leads to the outcomes you want and then assess people on those factors.
  • Some common problems when evaluating people include context (attributing results to a person when the environment drove success or failure), interdependence (assessing on an individual level a result that was driven by a team), self-fulfilling prophecies (people perform consistent with expectations) and reverse causality (we attribute causality to correlation, even though the factors may not be related or may be in the other direction).
  • You should assess how your team or company works as a network, looking at the relationships, and then encourage and grow ones that lead to desired outcomes.

Share this:

  • Click to share on Facebook (Opens in new window) Facebook
  • Click to share on LinkedIn (Opens in new window) LinkedIn
Like Loading...
Unknown's avatarAuthor Lloyd MelnickPosted on September 9, 2020June 17, 2020Categories Analytics, General Social Games Business, General Tech BusinessTags bias, collaboration, interdependence, network analysis, People Analytics, performance evaluation, recruiting2 Comments on People Analytics for Online Gaming

Summer highlights from The Business of Social Games and Casino

Summer highlights from The Business of Social Games and Casino

Normally, I take the summer off from writing blog posts but 2020 is anything but a normal year. Unfortunately for many, the pandemic meant you had to cancel or postpone your holidays or had more time to add to your knowledge. Thus, I continued to post but at a slightly reduced schedule. If you were lucky enough to get away, below is a summary of my posts over the summer that you may have missed, enjoy.

Lifetime Value Part 29: Increasing Retention

Key Takeaways

  • Retention is the strongest driver of LTV and data from Google shows the most important retention KPI is the amount of players who return on day 2 after installing your game.
  • The strongest driver of D2 retention is how many minutes your customers stay/play within the first ten minutes of starting the app.
  • To improve retention between the first and second days, make the early experience faster and more fun by improving load times (while reducing secondary loading), making your lobby intuitive, and not distracting your player with a bad tutorial or promotions.

Behavioral Economics Tips for Gaming Companies

Key Takeaways

  • A key lesson of behavioral economics is that less choice often drives better results. When the number of choices increases, our ability to make a decision decreases.
  • Consumers hate uncertainty. Questions without answers cause fear and kills the experience and sales, it is a customer experience killer.
  • Use AB and multi-armed bandit tests help you understand how your players will react in the context of your game, market research conversely might provide bad information as people do not know what they want.

How to avoid meetings about the trivial, aka bikeshedding

Key Takeaways

  • Bikeshedding is the tendency we have to spend excessive time on trivial matters in meetings, often glossing over important ones.
  • Bikeshedding is damaging because it wastes very valuable time and, more importantly, leads to insufficient discussion of important issues.
  • To avoid bikeshedding, set a clear purpose for all meetings (and eliminate conversations about other issues), only invite necessary people, appoint a decision maker and have the decision maker set clear parameters for the meeting.

Lifetime Value Part 30: Why clumpiness should be one of the KPIs you focus on

Key Takeaways

  • We normally focus on analyzing recency, frequency and monetization of the customer but by adding a new KPI, clumpiness, we get a much better understanding of their expected value.
  • Clumpiness refers to the fact that people buy in bursts and that those customers could be extremely valuable.
  • Clumpiness can help you better segment players, predict VIPs and target your reactivation efforts and spend.

Why Evo’s $2 billion+ acquisition of NetEnt is more important (to both iGaming and social casino) than you think

Key Takeaways

  • Evolution Gaming, the largest Live Dealer provider, recently announced a bid to acquire NetEnt, the largest slots provider for $2+ billion.
  • The deal, in that Evo is the acquirer, shows that Live Dealer is eclipsing slots in the casino ecosystem.
  • For real money operators, they need to ensure they balance resources around both Live Dealer and slots while social casino companies need to figure out the best way to embrace this opportunity.

Customer analytics tips for gaming companies

Key Takeaways

  • People who wander around a retail location spend more than ones who immediately find what they are looking for and retailers optimize to create this jiggliness. Online casinos and games can also build in jiggliness so players find new games and offerings rather than simply quickly go to the one they are looking to play.
  • While satisfaction with customer service positively impacts profitability, the relationship is not linear. Improvements have a strong impact when players are highly dissatisfied (and that is corrected) or when customers with great service make further improvements, companies in the middle often do not see a positive ROI on CS improvements.
  • A relationship between two variables does not show one is causing the other, to have causation there must be a relationship plus temporal antecedence plus the absence of a third variable driving both factors.

How to get your big initiatives done

Key Takeaways

  • Many important initiatives, from new products to operational efficiency, bog down and die in the middle phase. They initially have momentum but stall once the initial burst dies down.
  • To MOVE projects through this middle phase, the Middle element needs a clear and concrete strategy and you need an Organizational structure with capacity to complete the initiative.
  • The final keys to getting through the middle phase are Valor, making tough decisions and prioritizing the initiative, and getting Everyone involved.

How Operations Analytics can help online gaming companies

Key Takeaways

  • While Operational Analytics are a focus primarily in retail and traditional businesses, there are many best practices that iGaming and social game companies can leverage.
  • Forecasting is central to generating and earmarking resources but is often a challenge for game companies, rather than trying to create a point forecast create a range based on moving averages and looking at standard deviation. For new products, create a simulation that will show the distribution of potential outcomes and the risks and rewards possible.
  • You need one, and only one, distinct goal and then optimize your strategy around that goal; it’s impossible to optimize for multiple goals. Use constraints to incorporate what used to be additional goals.

The risks of market research

Key Takeaways

  • A sole reliance on customer input and feedback, traditional market research, is built on a model of human decision making that assumes humans are rational, while in practice we are not.
  • Not only do people provide a response inconsistent with their actions, they often do not understand the underlying causes of their behavior.
  • Use one or multiple tools that show actual decision making, such as ABn testing or looking at reactions to similar initiatives in adjacent industries, rather than relying on what customers believe is their preference.

Share this:

  • Click to share on Facebook (Opens in new window) Facebook
  • Click to share on LinkedIn (Opens in new window) LinkedIn
Like Loading...
Unknown's avatarAuthor Lloyd MelnickPosted on September 2, 2020August 29, 2020Categories Analytics, behavioral economics, General Social Games Business, LTV, Social CasinoTags behavioral economics, LTVLeave a comment on Summer highlights from The Business of Social Games and Casino

How to Build the Amazon of Game Companies!

How to Build the Amazon of Game Companies!

It is always a lot of fun, and a real honor, to be on the Deconstructor of Fun podcast and I was recently part of a quite robust conversation, How to Build the Amazon of Game Companies! I was joined by Kristian Segerstrale (Co-Founder of both Glu Mobile and Playfish as well as CEO of Super Evil Megacorp) and Mark Sottosanti (SVP Strategic Advisory at Riot Games) as well as Deconstructor’s own legend, Joseph Kim. Spoiler alert, it is really hard to build the Amazon of game companies, just look at Amazon.

amazon

Share this:

  • Click to share on Facebook (Opens in new window) Facebook
  • Click to share on LinkedIn (Opens in new window) LinkedIn
Like Loading...
Unknown's avatarAuthor Lloyd MelnickPosted on August 17, 2020August 14, 2020Categories blue ocean strategy, General Social Games BusinessTags amazon, Kristian Segerstrale, Mark SottosantiLeave a comment on How to Build the Amazon of Game Companies!

How Operations Analytics can help online gaming companies

How Operations Analytics can help online gaming companies

I recently took an online course from Wharton on Operations Analytics and it was valuable because it was for traditional businesses, not game companies. Social game companies are great at player, marketing and customer analytics, to the point where it is hard to eke out competitive advantage using analytics because everyone is so good; it is largely the cost of doing business. To gain an edge it is sometimes useful to look outside the space and learn best practices from other industries, even ones considered less sophisticated than online gaming, and apply these insights to our business.

newsvendor

While Operations Analytics is a focus for retailers and bricks-and-mortar businesses, it often does not make it on the radar for social, mobile and iGaming companies. The foundational problem in the space is even referred to as the Newsvendor Problem, clearly based on a very traditional business. After taking the Operations Analytics course, I realized many useful applications for gaming companies from this field.

Forecasting demand and allocating resources

I have worked at many large gaming companies, including several that were public companies, and, despite the companies reliance on analytics, financial forecasting was at best a guess, at worst a hope. A retailer, especially a land-based one, lives or dies by its forecasts. Order too much and you are left with potentially worthless inventory. Order too little, and you miss profits that can then be used to market, grow or sustain during seasonal periods.

Accurate forecasting is critical to make valid decisions today (hiring, investing, M&A, etc.), and it is as critical for online gaming companies as it is for a bricks-and-mortar business. For example, a good forecast will help you hire the right size Customer Support team. It will also help you optimize cash flow, manage your marketing expense, allow you to seek financing preemptively, determine when to launch new content and features and more.

The first key learning from Operations Analytics related to forecasting is that point forecasting are usually wrong. Point forecasts are unreliable not only in business but in all elements of life. The chance of predicting the amount of rainfall next month accurately is close to zero.

Instead, a good forecast should be a range, showing the likely outcomes. When modeling an uncertain future, you build probability distributions based on past data (and possibly incorporating expert estimates). You can put likelihoods on different scenarios, such as low, normal and high. When looking at your potential sales for an online game (or your portfolio of games), which is almost a continuous distribution of scenarios (like amount of rainfall), you want to group the scenarios rather than create individual ones, a continuous distribution.

One of the core ways of using existing data is to base forecasts on moving averages, a practice I recently implemented and have seen quite useful. A moving average is a forecast based on the average of the n most recent observations. In my case, we have created much more accurate predictions looking at the past 28 days of data (so n=28), taking both the mean and standard deviation. It is not a perfect tool, though, as it misses trends (i.e. pandemics) and does not show causation.

While finding the mean and standard deviation of past data is a good foundation for creating your forecast, sophisticated companies integrate additional sources of information. These may include an aggregation of forecasts (for example from each of your product managers), customer surveys (how much they expect to change their purchasing behavior), a jury of executive opinion (what your leadership team thinks) or the Delphi Method (individual opinions that are compiled and reconsidered again and again until there is a consensus).

Smoothing data for seasonality

Another common practice in operations analytics that is not always used in online gaming is smoothing for seasonality. While game companies are keenly aware that sales (and other KPIs) will be impacted by day of the week or hour of the day (referred to as seasonality), some companies are better than others at adjusting for this seasonality.

article1-seasonality-792x350

Most game companies realize these differences and will not compare Saturday revenue with Sunday revenue. Instead, they will look WoW (week on week) and compare Saturday with the previous Saturday. The weakness in this approach is that a lot happens in seven days so you are losing very useful information in the comparison, rather than seeing immediate trends you are dealing with a seven day delay.

An approach to avoid this problem is to remove seasonality from the numbers. You can do this by looking historically at the numbers, creating a sample mean, then finding seasonal averages (if we are looking at day of the week you would have a mean for Mondays, a mean for Tuesdays, etc), divide the seasonal averages by the sample mean to create a seasonal factor and then divide each observation by the seasonal factor. By using a seasonal factor, you can identify immediately any big deviations and not have to wait a week to understand if your game is broken.

Projecting new game launches and other high uncertainty situations

While online game companies are not always sophisticated in modeling their forecasts, it gets much worse when projecting for new games. Some companies rely on the wishful thinking strategy, projecting what revenue will be if the game is a hit (despite the fact less than 20 percent of new games are successful). Others take the opposite tack, assuming no revenue from new projects until they already have data. Neither of these approaches provides useful information for companies’ planning. They either muddy the water so that people do not take the financials seriously or provide misleading data that leads to too much or too little additional resources (such as hiring support staff or preserving marketing budget).

While there is significant variance in potential outcomes for new games, there are methods to create a usable range for forecasting purposes. Given that there is limited (possibly a soft or beta launch) or no actual demand data, you need to augment that data with other sources:

  • Sales of similar games. How have comparable products done at launch and over time.
  • Composites. Estimates from the product team or marketing.
  • Customer surveys. Responses from target customers to market research.
  • Jury of executive opinion. Estimates from your executive or leadership team.
  • Delphi method. Individual opinions compiled and reconsidered, repeat until overall group consensus is (hopefully) reached.

You then should refine your estimate based on past experience. Look at previous estimates and compare them to actuals. If you are historically 5X overly optimistic or 20 percent overly pessimistic traditionally, adjust your estimate to reflect this historical variance. Also use the historical data to calculate a standard deviation, so you can create a forecasted range of potential values, rather than a specific number. Then incorporate this range in your planning.

A more advanced method to use when estimating a new product launch, or anything else where there is a high level of uncertainty, is simulation. You can build a simulation of a new product launch using a third party tool (StatPlus is one such tool) coupled with the projections above. You can then see 100 or 1,000 or more likely outcomes with a distribution similar to past product launches. This simulation will then not only give you a range of likely outcomes but also help you identify best and worst case scenarios, so you can accurately gauge risk and reward. You can then optimize your internal resource allocation (i.e. hiring new support agents or performance marketers) by optimizing for reward while using your risk measures as a constraint.

Focused goals

focus

For me, the most valuable insight from operations analytics is that you should only have one goal. When creating an optimization model, you optimize for one decision variable (revenue, profit, cost, etc.), changing multiple variable within constraints. It ends up being a, sometimes complex, algebraic model with a solution. Mathematics such as this, however, can also have a broader application.

Linear regression

I will never forget an executive committee meeting I had several years ago where a new CEO said we have two goals, grow top line revenue like a growth company and grow margin. At the time, several people asked which is more important and the CEO responded they both are, we need to optimize for both. Fast forward several years later and the company wallowed in mediocrity, without significant organic revenue or margin growth.

So what does that story have to do with the math behind optimization models? In an optimization model you can only optimize for one objective. You can optimize for profitability or revenue but if you try to optimize for both, Excel would give you a big error message saying it is impossible to optimize for both. Instead you can optimize for one and set the other as a constraint (optimize for growth with margin >= 20%). This mathematical reality is also a strategic reality, when setting your objective variable do not set multiple objectives but make the hard decision as to what is most important and then use the others as constraints when building your strategy.

Key takeaways

  • While Operational Analytics are a focus primarily in retail and traditional businesses, there are many best practices that iGaming and social game companies can leverage.
  • Forecasting is central to generating and earmarking resources but is often a challenge for game companies, rather than trying to create a point forecast create a range based on moving averages and looking at standard deviation. For new products, create a simulation that will show the distribution of potential outcomes and the risks and rewards possible.
  • You need one, and only one, distinct goal and then optimize your strategy around that goal; it’s impossible to optimize for multiple goals. Use constraints to incorporate what used to be additional goals.

Share this:

  • Click to share on Facebook (Opens in new window) Facebook
  • Click to share on LinkedIn (Opens in new window) LinkedIn
Like Loading...
Unknown's avatarAuthor Lloyd MelnickPosted on August 12, 2020June 7, 2020Categories Analytics, General Social Games Business, General Tech Business, Social Games MarketingTags Forecasting, goals, Operations Analytics, seasonality3 Comments on How Operations Analytics can help online gaming companies

Customer analytics tips for gaming companies

Customer analytics tips for gaming companies

While social and mobile gaming companies are generally at the cutting edge of applying analytics, I recently took an online course from Wharton on Coursera that provided some additional insights in how to best use analytics in online gaming. These takeaways range from ways to improve your UI to how to calculate LTV more accurately.

Make your players wander

One of the most interesting takeaways from the course is that efficiency is not always the desired player behavior in the online world. In traditional retail, retailers found they enjoy much higher revenue when customers wander around the store rather than quickly find what they have come for. In the studies cited, about 75 percent of movement inside a store is not required. Sixty percent of purchases are items people had no intention of buying when they went into the store. Instead retailers optimize for “jiggliness,” as people with the most jiggliness buy the most.

jiggliness

There are uses of this concept for online gaming and iGaming companies. Rather than optimize your lobby and UI (user interface) to ensure your players find what they are looking for, take them on a journey around your game. If it is a social casino, rather than finding the slot they know and love, expose them to some other content, they may find something they prefer.

Higher customer satisfaction may not improve profitability

While customer satisfaction is positively correlated with profitability, the relationship is not linear. Companies with a low level of customer satisfaction, referred to as the Zone of Pain, experience a strong impact on revenue when making improvements. That is, the firms with awful customer service see big benefits just moving out of the Zone of Pain.

On the high end, companies that provide great customer service and differentiate themselves with it experience positive ROI by making the experience even better. These companies are what is referred to as in the Zone of Delight. Retailers like Nordstroms, which enjoy high margins due to their customer service, see a huge impact when they find even better ways to provide a WOW experience.

nordstrom

When customer satisfaction is only a small part of a company’s value proposition, improvements do not necessarily have a positive return. There is a large flat region where increasing satisfaction does not increase profitability. The key takeaway is that the relationship between customer satisfaction and profitability is not linear, but starts with a Zone of Pain, then hits a sizeable flat region, and then moves to a Zone of Delight.

Correlation does not equal causation

We should all know by now that just because two variables have related movement, you cannot assume one is causing the other. I see this mistake made frequently, including by BI experts. Correlation only shows a relationship between two variables. Causation, more critically, shows that one variable produces an effect on the other variable. It is crucial to remember there are three requirements for causality:

  1. Correlation
  2. Temporal Antecedence. X must happen before Y.
  3. No third factor is driving both. Need to control for other possible factors.

Use analytics for pricing

I am surprised at how often pricing strategy in mobile games (the cost of in-app purchases) or in iGaming (RTP and bet levels) is driven by competitive analysis and intuition rather than analytics. Regression, however, can be used to set optimal pricing (including for virtual goods) at the level that boosts profits. Regression can predict demand at prices that have not been tried, thus you can determine profitability for different options. As predictions can be completed for different future prices, you can then determine optimal price. Effectively, you answer the question what you can charge to make the maximum profit (and with virtually zero marginal cost for online products, can be simplified to maximum revenue).

Preparing better surveys

While market research is a less than reliable way to understand customer intent, it still provides valuable insights into your players. Surveys are a good way to learn about potential customers and are relatively low cost. Some best practices include:

    • To improve reliability of surveys, test and then retest. If the results are consistent, it shows you are getting reliable results (people still may not know what they want though).
    • There are multiple ways to ask questions in a survey (comparative, rank, paired comparison, Likert, continuous, etc.) and you should understand your end goal when deciding which format to use. Advantages of open-ended questions allow for a general reaction that can help interpret closed end questions and may suggest follow up questions. Closed end requires a lot of pre-testing but is easier to administer.
    • Focus on drafting high quality questions. Use simple, conventional language and avoid ambiguity. Do not ask any questions more than 20 words. Most importantly, avoid leading and loaded questions (i.e. How bad a job is Lloyd doing?).
    • Pay attention to sequence and layout. Start with an easy and non-threatening question. Have a smooth and logical flow. Have the questions go from general to specific. Keep the sensitive or difficult question at the end.
    • The key to using surveys effectively is validity, how well it predicts variables you are interested in. If you find surveys effectively predict certain behavior, then they are an appropriate tool for predicting that variable.
    • Make sure your results are generalizable to an appropriate population. You need to define clearly the population, choose a representative sample, select respondents will to be interviewed and motivate them to provide information.
    • Pre-test your survey. Ensure respondents understand each question and the questions make sense.
    • Collect data on non-respondents as they may be systemically different. Try to convert them to responding.

Recency is incredibly important

When looking at the future value of a customer, the three keys are how recently they made a purchase (recency), how many purchases they have made (frequency) and monetization (size of the purchase) recency is by far the best predictor of future value. Frequency is then significantly more indicative than monetization. Thus, focusing on increasing the size of a purchase (up-selling) is the least valuable strategy you can pursue to increase your customer’s lifetime value.

Include clumpiness in your LTV analysis

I wrote several weeks ago about the important of clumpiness in determining a customer’s future value so will not go into too much detail again. Clumpiness refers to the fact that people buy in bursts and that those customers could be extremely valuable. When calculating customer value and segmentation, we focus on analysing recency, frequency and monetization of the customer, as I discussed above. This analysis is based on customers making purchases in a regular pattern, i.e. coffee, diapers or milk. For certain products (and I would classify social and casino games here), customers actually monetize in bursts. Thus, you need to add C for clumpiness to your modeling.

Key takeaways

  • People who wander around a retail location spend more than ones who immediately find what they are looking for and retailers optimize to create this jiggliness. Online casinos and games can also build in jiggliness so players find new games and offerings rather than simply quickly go to the one they are looking to play.
  • While satisfaction with customer service positively impacts profitability, the relationship is not linear. Improvements have a strong impact when players are highly dissatisfied (and that is corrected) or when customers with great service make further improvements, companies in the middle often do not see a positive ROI on CS improvements.
  • A relationship between two variables does not show one is causing the other, to have causation there must be a relationship plus temporal antecedence plus the absence of a third variable driving both factors.

Slide1

Share this:

  • Click to share on Facebook (Opens in new window) Facebook
  • Click to share on LinkedIn (Opens in new window) LinkedIn
Like Loading...
Unknown's avatarAuthor Lloyd MelnickPosted on July 15, 2020June 27, 2020Categories Analytics, General Social Games Business, General Tech BusinessTags analytics, Clumpiness, customer service, Jiggliness, pricing, recency, survey3 Comments on Customer analytics tips for gaming companies

How to avoid meetings about the trivial, aka bikeshedding

How to avoid meetings about the trivial, aka bikeshedding

I have written before on my general distaste of meetings and how they frequently destroy more value than they create, and one of the key reasons I detest meetings so much is they always seem to be about trivial things. A recent article, Why We Focus on Trivial Things: The Bikeshed Effect, explains why we gloss over important topics and focus on the trivial. Bikeshedding is a metaphor to illustrate the tendency we have to spend excessive time on trivial matters, often glossing over important ones.

What is bikeshedding and why it is a problem

Bikeshedding comes from an example by Cyril Northcote Parkinson, the father of Parkinson’s Law (tasks expand to fill the amount of time available), that explains the amount of time spent discussing an issue in an organization is inversely correlated to its actual importance. We discuss important complex issues minimally while simple, minor ones get the most attention.

In Parkinson’s example, an executive management team has three issues on its agenda

  • Build a $10 million nuclear power plant
  • Build a $350 bike shed
  • Allocate a $21/year coffee budget

Rather than focus the conversation on the big project, the power plant, the team runs through that proposal quickly. In Parkinson’s example, “[i]t’s too advanced for anyone to really dig into the details, and most of the members don’t know much about the topic in the first place. One member who does is unsure how to explain it to the others. Another member proposes a redesigned proposal, but it seems like such a huge task that the rest of the committee decline to consider it.”

When the conversation moves to the bike shed, it heats up. Everyone on the team is comfortable expressing thoughts on it. They all know what a bike shed looks like. They have different ideas on the material to use for the roof and potential small cost savings. The team spends more time discussing the bike shed than the $10 million nuclear power plant.

Finally, the team ends up spending the most time talking about the coffee budget. With coffee, everyone on the team is an authority. Each person knows about coffee and has a strong sense of cost and value. At the end of the meeting, they have spent more time discussing the coffee budget than the bike shed or the power plant combined. As they say in the post, “everyone walks away feeling satisfied, having contributed to the conversation.”

There are two critical issues caused by bikeshedding:

  1. Not enough time is spent discussing the power plant and the critical issues related to it. This decision potentially alters the trajectory of the company and a mistake could cost a lot of money or be fatal to the firm. By not looking at the details, even a small misstep can have a big impact.
  2. Even taking away the opportunity cost, wasting time talking about a cheap coffee plant or bike shed is likely to cost more in the value of time than any gain. Assuming each executive is well compensated, the value of their time spent talking about coffee is likely to run in the thousands of dollars.

Why do we have bikeshedding

Given the absurdity (and uncanny truth) of the above example, it begs the question how does this happen (and we have all seen it happen). According to the post, “the more people will have an opinion on it and thus more to say about it. When something is outside of our circle of competence, like a nuclear power plant, we don’t even try to articulate an opinion. But when something is just about comprehensible to us, even if we don’t have anything of genuine value to add, we feel compelled to say something, lest we look stupid. What idiot doesn’t have anything to say about a bike shed? Everyone wants to show that they know about the topic at hand and have something to contribute.”

During meetings, we reward people simply for expressing an opinion rather than for having put in the time and work to develop the judgment. Most importantly, people should focus on contributing when you have something valuable to add that would result in a better decision.

How to mitigate bikeshedding

Slide1

Once you acknowledge the problem of bikeshedding, there are several steps you can take to avoid the issue and spend the appropriate time each issue demands:

  1. Have a clear purpose. Successful meetings need to have a clear and well defined purpose. Specificity is central to having a purpose and conveying it.
  2. Invite the right people. Only invite people who can contribute to the discussion or are needed for execution of the decision. If the purpose is to discuss the nuclear power plant, this purpose will make it clear who should and should not be in the meeting. As the post points out, “the most informed opinions are most relevant. This is one reason why big meetings with lots of people present, most of whom don’t need to be there, are such a waste of time in organizations. Everyone wants to participate, but not everyone has anything meaningful to contribute.”
  3. Appoint a decision maker. To reach the best outcome, you need a designated decision maker. First, it avoids forcing a consensus when there should be a black and white winner, a compromise is not always better than an extreme option. Also, it is often impossible to reach a consensus when nobody is in charge. The discussion just drags on and on.
  4. Have the decision maker set clear parameters. With one person in change, they can decide in advance how much importance to accord to the issue (for instance, by estimating how much its success or failure could help or harm the company’s bottom line). They can set a time limit for the discussion to create urgency. And they can end the meeting by verifying that it has indeed achieved its purpose.

By implementing these steps, you can help your company focus its efforts on finding solutions to the most intractable and important problems and let picking the right type of coffee to someone else.

Key takeaways

  • Bikeshedding is the tendency we have to spend excessive time on trivial matters in meetings, often glossing over important ones.
  • Bikeshedding is damaging because it wastes very valuable time and, more importantly, leads to insufficient discussion of important issues.
  • To avoid bikeshedding, set a clear purpose for all meetings (and eliminate conversations about other issues), only invite necessary people, appoint a decision maker and have the decision maker set clear parameters for the meeting.

Share this:

  • Click to share on Facebook (Opens in new window) Facebook
  • Click to share on LinkedIn (Opens in new window) LinkedIn
Like Loading...
Unknown's avatarAuthor Lloyd MelnickPosted on June 17, 2020May 23, 2020Categories behavioral economics, General Social Games Business, General Tech BusinessTags Bikeshedding, Meetings1 Comment on How to avoid meetings about the trivial, aka bikeshedding

Behavioral Economics Tips for Gaming Companies

Behavioral Economics Tips for Gaming Companies

I recently completed an online course that featured two of my heroes of Behavioral Economics, Oglivy Vice Chairman Rory Sutherland and Duke Professor Dan Ariely, and it included many takeaways that can be applied to gaming companies (social gaming and iGaming). Consumer psychology is changing marketing and product development more than technology so understanding the core principles of behavioral economics is vital to growth, and survival. While I recommend taking the full course (especially the case studies there), below are some of the learnings that would be useful to game companies.

mindworx

Avoid information or choice overload

A key lesson of behavioral economics is that less choice often drives better results. People can only consciously process a small amount of the information coming in, thus options rich in choice can be too much stimulation. When the number of choices increases, our ability to make a decision decreases.

This issue is clear on a test run in a US grocery store. There was a famous experiment where one group of consumers in a super market had 24 jams available while the other had six. The people exposed to 24 options sampled more but actually bought fewer items. If you are not a big jam eater, another way to visualize the issue is to think of driving into an empty parking lot; with so many choices you have no idea where to park and will probably spend more time driving around than if there were two open spots.

This phenomenon is referred to as choice overload, where the number of choices diminishes sales. For game companies, this issue can translate into how many options to offer in the cashier or how many slot machines to make available when a player first enters your game. The key is more is often not better for your customers or your revenue.

Avoiding choice overload with smart choice architecture

When you are building and optimizing your product, you need to focus on the choice architecture, how you frame and present different options to elicit a desired response. There are several ways to provide the right option for your player while optimizing the choice architecture. One is to consider chunking. In 1956, George Miller found that 7 +/- 2 was the magic number that people could remember. People can recall between 5 and 9 pieces of info in working memory. Thus, rather than giving your customers more than this magic number of choices, create subsets so once they make one decision they can then decide between another seven options. In a game, rather than showing five virtual swords, five virtual arrows, five virtual shields and five virtual loot boxes, offer the customer the choice between swords, arrows, shields or loot boxes. Once they click on one of those, and then show them the five sub-options. Also keep in mind the chunking needs to be meaningful, if you instead sort them by color, people are unlikely to find options they are willing to purchase.

Another technique in optimizing choice architecture is allowing players the freedom to make choice. By affirming someone’s freedom, we can actually make him feel more confident of his decision. To encourage someone to do something, a counter-intuitive response may be to remind them that they are free not to make the purchase.

While there is a magic number, there is no perfect choice architecture for every scenario and product. Hypothesis and testing is critical here. Never stop testing and improving as people will react differently to choices depending on the product, the platform, where they are in the product, etc.

Anchoring is a key driver in perception of cost

Another useful tool for improving performance is anchoring. Anchoring occurs when initial exposure to a number or option serves as a reference point and influences future decisions and purchases. The anchor price, even if a random number, becomes part of a decision set. Once we make a decision about a particular number, that decision stays with us. You then compare other options to the starting point.

Anchoring is used in many situations and businesses. In a restaurant, by having an expensive menu option (i.e. lobster) it makes the other options seem cheap, even though they may be more expensive than you originally were prepared to spend. In the gaming world, if you offer a $1,000 package on your purchase page, while few might buy it, it makes the $50 option look very cheap.

One other element of anchoring is that it is hard to move from free to a cost. We say to ourselves I have been willing to pay zero, I am anchored to zero, so anything above zero does not fit with my historical view of not willing to pay. This is particularly important when we introduce new products to market as it will make it hard to change the price later.

Decoy and middle action

Recently, I wrote about the decoy effect, another pricing strategy based on behavioral psychology. The decoy effect is used when pricing products, adding a third option that drives customers to the most expensive or profitable option. A phenomenon called asymmetric dominance causes customers to change their preference between two options when a third option is presented. The decoy effect is also driven by choice overload, as customers who face many options will adapt by reducing the number of criteria they use for choosing.

What drives the decoy effect is that people derive value not from the intrinsic utility they get from a product but how it compares. Value comes from comparison, if we create comparison, customers will use it, otherwise they will create their own. The simple contrast allows for relativity to show up and point to the option that looks better to something in the set. For example, if you go to Walmart for a TV and there is one option that is $200 and another that is $500, you probably will see if the latter is worth an extra $300. However, if there is also a TV that costs $1,000 but is virtually the same as the $500, you are likely to buy the $500 because it feels like such a bargain, as you are effectively a $1,000 TV. This is a very powerful tool when presenting options to your customers.

Game companies can use the decoy effect when presenting options for in-app purchases. By bundling a high priced virtual good with many other items but not charging for the other items, then putting that bundle next to the virtual good only option, the high priced option appears as a bargain.

We hate uncertainty

Another useful lesson from behavioral economics is that people hate uncertainty. Questions without answers cause fear and kill the user experience and sales, uncertainty is a customer experience killer. Before worrying about motivating your customers, think about the questions and concerns they have and answer them in the first place.

One issues that increases uncertainty (and thus likelihood to lose a sale or customer) is a situation where the customer has missing or incomplete information. Their fears and concerns are not answered. They might not know what happens after they enter their email address or send you their banking information. This uncertainty makes it much more difficult for you to elicit the desired response.

Netflix shows how reducing uncertainty and risk can lead to billions of dollars. The most important message on Netflix’s landing page is not about features, it is the option to cancel anytime. Netflix then sends a reminder email before the free trial ends so the customer can cancel, which answers your uncertainties. This emphasis allows customers to go through the whole process on autopilot rather than full alert. One of the keys to Uber’s success is customers knowing where the car is and expected arrival time, which has proven more important than the car arriving quickly or even price.

Personally, I have found that during the pandemic lockdown, I stopped ordering from local shops that did not provide updates on delivery and kept ordering from the ones who told me when to expect the order. In retrospect, that knowledge (lack of uncertainty) was a much stronger factor than speed of delivery, price or even quality.

Another area of uncertainty that is often neglected is in pricing. Many companies are not very transparent in their pricing, you may not know the cost of a conference or purchase until you click the buy button. What these companies do not realize is that people assume prices are higher than they actually are and may abandon the potential purchase before learning that the price is acceptable.

Other ways game companies can reduce uncertainty include

  • Your customers must understand how they can do what they want to do.
  • Map the uncertainties and remove them. Give explanations on why you are asking questions or need information.
  • Tell people how others have gotten through the process, if others have succeeded customers will experience less uncertainty and feel a reduced risk.

Make it seem easy

As well as reducing uncertainty, you need to minimize perceived effort. Making something easy is different than making it feel easy. Keep in mind that people also equate effort with time, so you should focus on reducing the time people expect to complete a task (purchase, registration, verification, etc) as a proxy for difficulty.

The key is perception. The perceived effort is not about what your customer has to do but how difficult they think it will be to accomplish. To highlight the difference between perception and reality, during the course it was pointed out that if you ask your customers how difficult an action is to undertake, the objective effort only accounts for 1/3 of their answer, 2/3 comes from how your customers feel.

You also not only want to make the desired action easy for your customer, you want them to see it as the easiest option available. There are three ways to make a task seem easy:

  1. Structure. Our mind works in structures, we seek patterns. That’s why and how we understand information. Bring structure into everything you are telling your customers.
  2. Language. Avoid toxic words like have to, must, need, it’s required, which make the customer feel it is difficult. Replace these words with ones like easy, quick and short.
  3. Chunking progress. Seeing the progress is extremely motivating. Chunk the process into small and easy steps and highlight the process.

Reducing friction helps with both ease and uncertainty

Reducing friction is one of the best ways to generate desired behavior. Friction is the blockers that a person needs to go through to complete an action. When making a purchase, it could be entering an email address, credit card number and then setting up an account. The more friction, the more likely the customer will quit before completing the action. Each element of friction increases abandonment rates.

In the course, they use Best Buy (a US retailer) as an example. Best Buy ran a test for its online site to allow people to purchase without setting up an account, what they called Express Checkout. Adding this option increased Best Buy’s revenue $300 million in one year. The cost in lost data was also less than expected, over 60 percent of people still set up accounts (showing that reducing friction early often leads to people completing the same actions later).

The Best Buy example shows that the solution to reducing friction can be eliminating something. Removing a step in the process can be very effective to increase conversion. When designing a process, question what information
is absolutely critical to collect along the process. Part of the design process should be minimizing the subtle cognitive load you placing on your customer.

There are several other ways to reduce friction:

  • Pre-fill information so your customer does not have to fill out every field (or preferably any fields).
  • Look at pre-existing behavior (paving the cow path). It is easier to design for behavior that is already occurring and not ask your customers to change what they are doing.
  • Bundle new behavior with existing actions. Observe existing behavior, possibly things happening at the same time of the year, and bundle it with the desired action.

People need to feel they are treated fairly

Another element of perception important to driving behavior is the perception of fairness. When we evaluate products, we do not just evaluate what we received but evaluate the effort that went into it. If we feel the effort is higher, we are willing to pay a higher price.

People make decisions in context, in large part deciding what is fair. Rather than base a willingness to pay on the value or utility consumers are getting, fairness changes how we evaluate something and how much we are willing to pay. It is why consultants write large reports and why Steve Jobs spent so much time talking about the details on Apple products, letting customers feel it was fair to pay more for Apple products because of all the extra work to build it. We evaluate things based on effort, not on value. It is one of the weaknesses of online companies, especially online gaming companies, where it is difficult to judge the effort the company puts behind the product. If you are doing something magical for people but do not show them, they are less likely to pay a fair price (or monetize at all).

Salaries and compensation are one area where the perception of fairness is obvious. People who receive a high salary but then learn a co-worker is getting more compensation or has gotten a bonus often would look to find a new job or be dissatisfied because they feel they are not being treated fairly, even if their compensation is high. Conversely, employers will often make offers (either higher or lower) to candidates based not on the value the person would deliver or what they expect to pay for the position, but based on what the candidate earned at their current or previous jobs. They feel it is fair to pay candidates based on what they were earning, not on the value they will be delivering.

Learning salaries

In terms of selling virtual products, the perception of fairness is often an issue. To many outside the industry, it feels that virtual currency or virtual items are created without any effort, thus it is hard for people to rationalize a purchasing decision. For an online gaming company, one way to mitigate this situation is through your communications. Use social media to take players behind the scenes. Let them see how many people are putting their lives into creating a great game for them.

Do unto others

Reciprocity is another powerful tool often neglected, particularly in marketing. People are much more likely to perform an action if they feel you took the first step. In the course, they discuss a test where they provided customers an unsolicited gift. The test group that received the gift had a much higher conversion rate as customers felt a need to return the favor.

There are several techniques to benefit from reciprocity. To make reciprocity more powerful it should be unexpected, personal and valuable. Order is also very important, you have to say what you are giving first and after that ask for something. It is a technique you should not overuse, you do not want your customers to feel manipulated.

In a social game, you may find that giving your players a free, valuable, gift generates more purchases than a traditional offer. Rather than feeling sold at, they appreciate the gift and are compelled to make a purchase.

The power of loss aversion

One of the strongest drivers of behavior is loss aversion. People are much more sensitive to losses than gains, people are generally 2X to 2.5X more sensitive to losses than gains. That is, the opportunity for gain needs to be more than twice as big as what a player would lose to be a preferred option.

There are several powerful applications of loss aversion:

  1. Tell your customers what they would lose if they do not take desired behavior, the fear of the loss (including the lost opportunity) can be the strongest motivation.
  2. Rather than telling people to do something or make a purchase, position the item you want them to purchase as they already own it and have to claim it. If they don’t activate it, they will lose it.
  3. Reframe message from possibility of gaining to how your player would lose something.
  4. Make your customers picture what it would be like to own the product, have them dream about what it would be like and they will not want to give up the dream.
  5. Highlight progress, so they do not want to lose what they have done .

Social proof is one of your most powerful weapons

Social proof is conveying to your customers that others, particularly their friends, are doing something you want them to do. People have a tendency to be influenced by what others do and how they behave. In situations of uncertainty, telling people how others have acted is a strong indicator of what your customers should do.

There are several ways to optimize the effectiveness of social proof. You do not want to be too obvious or superficial, saying 9 out of 10 did something is likely to backfire as it feels like an old commercial. Instead, try to say what the majority does. Also personalize the social proof, make it as close as possible to the person you are communicating with. People are more influenced by others similar to you.

I recently experienced the power of social proof. A friend published a blog post reviewing four World War 2 books and I ordered one as a present for my son. I realized how powerful social proof was after my order as I did not read expert reviews or even see which ones had the best rating on Amazon, I made a purchasing decision based on one person’s non-expert opinion because he was a friend.

Also, avoid social proof in some situation. Do not say how many people are not doing something. It will make your customers questions that maybe they should also abstain. In a social game, you would not want to say 90 percent of players missed the opportunity to win this jackpot, do not be one of those losers. What the player will think is that if 90 percent did not take up the offer, why should they opt for it.

Grab attention with personalization

It is critical that you focus on grabbing your players attention, making things salient. We love the sound of our name; our brain activates differently when we hear our name. Personalization cuts through the clutter and makes communications relevant to us. If you can use someone’s name or make something unique and authentic for them, it will more likely succeed or cause conversion.

Building further on salience and personalization is the concept of idiosyncratic fit, as we see the world relatively, not absolutely. Idiosyncratic fit is the feeling that you enjoy a unique advantage in achieving a goal or completing a task. Consider what your players have already invested, how can you use this information to make them feel they have a benefit to others. In a game, you can give certain rewards to people for having played a certain amount of days or reached a level, ensuring they know they are getting this unique benefit because of things they have already done. This advantage will motivate them to keep purchasing or otherwise engaging.

Create defaults

Defaults are powerful as they help people avoid thinking. If people can avoid thinking, they will. Once you set up the desired action as a default or expected option, they are more likely to perform the activity. Restaurants make wine the default over cocktails (they make more on it) by providing a wine list instead of cocktail list and putting wine glasses on table, thus ordering wine is the default.

In a game, when asking players if they want to receive offers as part of the registration option, pre-check that field. When giving purchase options, test pre-checking the package you are hoping they purchase.

Free is one of your most powerful, and dangerous, tools

Free is much more than another price point. Free is not $0.05 less than $0.05, but is an incredibly powerful motivator. Free makes us think there is no risk (playing to the uncertainty principle) for a given choice. It is very attractive. If yu want people to test a new subscription option, give them a free week or month or year, it will be hard to say no.

The downside of free is that you anchor your customers at that price point.
Moving to free is very tempting, moving away from free is very difficult.
If you sell it for free, people might assume the quality justifies the price.

Test everything and early

One of the most important underlying principles of behavioral economics is that people do not know, and thus cannot tell you, what their preferences are. They do not know what they want until they experience it. Henry Ford said people would have asked for a faster horse. Steve Jobs never used market research on products like the iPod or iPad. Taking what customers say at face value can lead to disastrously wrong choices or limit your creative options. Instead, put your resources into testing.

While many, particularly Product Managers in San Francisco, believe AB testing is a recent phenomenon, it has been used by marketing companies for over 80 years. One of the reasons it has lasted and grown is that it provides clear and actionable results. In contrast, market research is very risky, as it does not show how people will react. People are not intentionally dishonest but are largely strangers to themselves and do not realize what drives their behavior. AB testing (and multi-armed bandit tests) allows you to see how people will react in practice, not theory.

It is both easier and more effective to apply principles of behavioral economics early in the product’s lifecycle. Rather than force your game out, test how people will react when you apply different principles of behavioral economics. Do not build your game based on assumptions how people will respond but instead test it.

If you test something and it works, then test the opposite. You might find that actually works as well or even better as people do not act predictably or linearly. Never stop testing, always look for something better.

Key takeaways

  1. A key lesson of behavioral economics is that less choice often drives better results. When the number of choices increases, our ability to make a decision decreases.
  2. Consumers hate uncertainty. Questions without answers cause fear and kills the experience and sales, it is a customer experience killer.
  3. Use AB and multi-armed bandit tests help you understand how your players will react in the context of your game, market research conversely might provide bad information as people do not know what they want.

Share this:

  • Click to share on Facebook (Opens in new window) Facebook
  • Click to share on LinkedIn (Opens in new window) LinkedIn
Like Loading...
Unknown's avatarAuthor Lloyd MelnickPosted on June 10, 2020April 5, 2021Categories behavioral economics, General Social Games Business, General Tech Business, Lloyd's favorite posts, Social CasinoTags A/B testing, Anchoring, behavioral economics, choice overload, dan ariely, Decoy Effect, defaults, fairness, loss aversion, reciprocity, social proof, uncertainty5 Comments on Behavioral Economics Tips for Gaming Companies

Lifetime Value Part 29: Increasing Retention

Lifetime Value Part 29: Increasing Retention

I have written many times about LTV (customer lifetime value) being the lifeblood for a successful business, as a new customer has to have a higher LTV than the cost of acquiring the customer, and how retention is the biggest driver of LTV. Given the importance of retention, a recent article by Google’s Adam Carpenter, Why the first ten minutes are crucial if you want to keep players coming back , provides great guidance on what to measure and then improve to have the most impact on improving retention.

Retaining new installs is arguably the most important driver for whether your product succeeds or fails. As Carpenter says, “retention is the primary metric, since if you can retain your new players, you can always figure out how to make money. If you can’t retain any players, you have no ability to make money.”

The metric to focus on is your day 2 retention (D2). According to Google’s data, median day 2 retention (number of users active on the day after they installed your game divided by the number of installs in your cohort) is 38 percent, while exceeding 46 percent puts your product in the top quartile (3/4 of all products would be doing worse than you if hit this target). Conversely, if your D2 is 22 percent, then 78 percent of the players you pay to acquire do not come back the next day. It is very hard to justify marketing spend if 78 percent is wasted.

Retention for Google Play

What you should be looking at

While the amount of time a player spends in your game after they install it is important, the critical factor is the first ten minutes. If you divide Carpenter’s data by performance, the strongest games (top quartile) average Day 2 retention of 52 percent, with 22 percent returning the next day with virtually no gameplay the first day and then seeing D2 steadily increase with each successive minute played (see chart below). The second quartile has a similar curve but starts at a lower point. The key, though, is the impact from the first ten minutes.
Day 2 retention

The first ten minutes

In Carpenter’s analysis, performance is driven by how quickly in the first ten minutes you lose players. For games in the top quartile, retention starts out good and steadily improves. In the second quartile, retention is essentially flat across the first minute and a half, and then begins to increase steadily. In the third quartile, retention is largely flat for the first four minutes, then increases but more slowly than highly performing games. In the lowest quartile, retention declines in the first two minutes and does not start to improve until the fifth minute.

These early patterns have a strong impact on players. The worst apps lose 46 percent of their new installs by the fifth minute and this number increases to 58 percent by minute ten (so in less than ten minutes you have less than half the players you have spent money acquiring). The top games, however, only lose 17 percent of players by the fifth minute and 24 percent within ten minutes (retaining more than twice as many players as the lowest group).

How to improve your situation

Once you understand the importance of the first ten minutes, you need to focus on improving this performance. Carpenter explain this as avoiding retention flats and gorges. “The first pattern is called the ‘Flats’. This anti-pattern shows largely flat retention for up to 10 minutes, with the percentages only rising meaningfully after the 5th to 10th minute. The second is the ‘Gorge’, whereby retention appears to drop minute by minute for the first five minutes or so, and then begins to rise again.”

Once you review your data, you can understand if you are suffering flats or gorges. To alter the curves, you can then:

  1. Improve loading times. Evaluate your loading times, keeping in mind new players are particularly sensitive to long loading times (they are have not yet decided they want to wait). In my experience, even a fraction of a second will surprisingly have a bigger impact than many sexy features.
  2. Avoid large secondary download. You may improve loading times by creating a long secondary download but the impact can be equally damaging. Players, particularly those on a poor wireless connection, may abandon your game.
  3. Make the lobby intuitive. Allow players to find quickly the action (and the action they want) in the game. If you are using a tutorial, ensure a smooth transition from the tutorial to where your player wants to go.
  4. Enhance or eliminate the tutorial. Speaking of tutorials, they are largely a reason to leave a game; rather than enjoying the product customers are being sent to school. See if you really need a tutorial and, if you do, how you can make it more fun.
  5. Do not overload player with promotions. Your goal on D1 is to get your player back on D2, monetization is a bonus on top of this goal. If the player returns, you will have many opportunities to monetize them. Do not sacrifice D2 retention by distracting players with sales and offers, have them focus on enjoying the game. I prefer to have none or at most one monetization promotion on day one.

By focusing on a quick, fun experience, you are more likely to get your customer to return on Day 2. As the Google data shows, if you get them back the next day, you will enjoy greater long-term success. By increasing this one KPI, you will experience a disproportionate positive impact on your LTV.

Key takeaways

  • Retention is the strongest driver of LTV and data from Google shows the most important retention KPI is the amount of players who return on day 2 after installing your game.
  • The strongest driver of D2 retention is how many minutes your customers stay/play within the first ten minutes of starting the app.
  • To improve retention between the first and second days, make the early experience faster and more fun by improving load times (while reducing secondary loading), making your lobby intuitive, and not distracting your player with a bad tutorial or promotions.

Share this:

  • Click to share on Facebook (Opens in new window) Facebook
  • Click to share on LinkedIn (Opens in new window) LinkedIn
Like Loading...
Unknown's avatarAuthor Lloyd MelnickPosted on June 3, 2020May 23, 2020Categories Analytics, General Social Games Business, Growth, LTVTags lifetime value, LTV, retention1 Comment on Lifetime Value Part 29: Increasing Retention

Taste, why creating a beautiful product is a key to success

Taste, why creating a beautiful product is a key to success

In the gaming world, we often deconstruct design into a set of data and AB tests to create products and features that will resonate with players. Design is sometimes even considered a bad word, implying that we are not data driven. Yet, companies like Apple (who I wrote about a few of weeks ago), have shown that valuing design highly can lead to billions in revenue. Additionally, I have seen many data driven companies where Product Managers create compelling beautiful PowerPoint presentations while share prices drop because customers do not flock to their products.

At the heart of the contempt of design is a feeling that it is based on taste and that taste is entirely subjective. Thus, the logic goes that there is no way to design for taste. A great blog post by Paul Graham, Taste for Makers, however, not only points out this thinking is false but also how designers can create beautiful products. To drive home that taste is not a subjective exercise, Graham mentions that, “[m]athematicians call good work ‘beautiful,’ and so, either now or in the past, have scientists, engineers, musicians, architects, designers, writers, and painters. Is it just a coincidence that they used the same word, or is there some overlap in what they meant? If there is an overlap, can we use one field’s discoveries about beauty to help us in another?”

Graham then breaks down the elements designers need to focus on to create something beautiful, something will be truly tasteful. If taste were entirely subjective a van Gogh would have no more value than a van Lloyd. Graham writes, “[s]aying that taste is just personal preference is a good way to prevent disputes. The trouble is, it’s not true. You feel this when you start to design things….[I]f your job is to design things, and there is no such thing as beauty, then there is no way to get better at your job. If taste is just personal preference, then everyone’s is already perfect: you like whatever you like, and that’s it.”

By looking into what is, and is not, appealing to people’s tastes, how design has evolved and what designs have failed, there are thirteen concept from Graham that can help guide good design. By following these principles, you are most likely to design a beautiful product.

Slide1

Good design is simple

The first key to good design is the same as the one that led to Apple’s success, a simple design is better than a complex one. Again, using mathematics to show that good design is not a subjective exercise, Graham points out that shorter math proofs are generally better.

While it seems like it would be easy to create a simple design, it is actually more difficult. It feels like extra work to create something ornate, to add features to a product or even to paint more objects in a picture. In practice, though, it is easier to create more mindlessly or not make difficult decisions on what people truly value than taking the time to understand what people want and eliminating what will be superfluous. Graham writes, “when you’re forced to be simple, you’re forced to face the real problem. When you can’t deliver ornament, you have to deliver substance.”

ipod shuffle

Good design is timeless

If you focus on designing a product that is “timeless,” by definition you are trying to create the best product design, not one that will be surpassed. Again, if you look at mathematics, a proof is timeless unless it includes a mistake.

Focusing on timelessness avoids falling for trends that are currently popular but short lived. Trends change over time and as Graham writes, “if you can make something that will still look good far into the future, then its appeal must derive more from merit and less from [trends].”

Good design solves the right problem

To create a beautiful design, you have to first understand what user problem it solves. Prior to finding an eloquent solution, you should ensure you are solving the right or underlying problem. As Graham writes, “[i]n software, an intractable problem can usually be replaced by an equivalent one that’s easy to solve. Physics progressed faster as the problem became predicting observable behavior, instead of reconciling it with scripture.”

If you look at bad design, it is often the result of solving the wrong problem. Why did Stadia fail, not because of its UI or UX but because it solved a problem that very few customers experienced (access to virtually unlimited content).

Graham uses the example of the stove top to illustrate the importance of solving the problem rather than designing in a vacuum. According to Graham, “the typical stove has four burners arranged in a square, and a dial to control each. How do you arrange the dials? The simplest answer is to put them in a row. But this is a simple answer to the wrong question. The dials are for humans to use, and if you put them in a row, the unlucky human will have to stop and think each time about which dial matches which burner. Better to arrange the dials in a square like the burners.”

Good design is suggestive

Rather than proscribing every step a customer takes, a great design will help customers envision how to use the product. Going back to mathematics, a proof that becomes the basis for new work is more beautiful than one that does not lead to future discoveries. Graham highlights several other examples, “In architecture and design, this principle means that a building or object should let you use it how you want: a good building, for example, will serve as a backdrop for whatever life people want to lead in it, instead of making them live as if they were executing a program written by the architect. In software, it means you should give users a few basic elements that they can combine as they wish.”

Opera house

If you look at the most successful design driven company of all time, Apple, you see this principle in practice. The iPhone was not great because its UI or design was limited, instead it let people use it the way they wanted to. It even let external companies (App developers) integrate with the design, something that would not have been possible (or at least as broad) if it was a very prescribed interfact. Apple products are not great because it is clear and easy how to do everything, I still have to Google functionality occasionally for my iPad and Mac, but they encourage consumers to explore the product and push it to its boundaries.

Good design is often slightly funny

Products that do not take themselves too seriously are more likely to be considered beautiful designs. Graham writes, “[t]o have a sense of humor is to be strong: to keep one’s sense of humor is to shrug off misfortunes, and to lose one’s sense of humor is to be wounded by them. And so the mark– or at least the prerogative– of strength is not to take oneself too seriously.”

The value of humor is often seen in movies (using movies as I can’t think of a funny mathematics proof). Marvel movies generally outperform those about DC characters, not because the superheroes are more famous or the special effects are better but because they incorporate humor into the stories.

Good design is hard

Design cannot be an afterthought but instead needs sufficient resources to create something beautiful. As form should follow function, if function is hard enough, form is forced to follow it, because there is no effort to spare for error. In math, difficult proofs require ingenious solutions that do not happen overnight. Graham writes, “[i]n art, the highest place has traditionally been given to paintings of people. There is something to this tradition, and not just because pictures of faces get to press buttons in our brains that other pictures don’t. We are so good at looking at faces that we force anyone who draws them to work hard to satisfy us. If you draw a tree and you change the angle of a branch five degrees, no one will know. When you change the angle of someone’s eye five degrees, people notice.”

While design is hard, you should not pursue difficulty for its own. There is beneficial pain and unnecessary pain. Graham explains, “[y]ou want the kind of pain you get from going running, not the kind you get from stepping on a nail.”

Good design looks easy

While good design is hard, it should appear easy to users. A mathematician might create brilliant proofs through months or years of hard work but the great ones will appear as if they created the proof overnight while reading the morning newspaper. Some of the best inventions are ones where we ask ourselves why we did not think of them previously. The great athlete looks like they are barely exerting themself while they are actually probably training 100+ hours/week.

In design what looks easy comes from practice. The more you train yourself, the more your subconscious handles the basic tasks freeing your mind on creating beautiful.

Good design uses symmetry

Symmetry is a powerful tool in helping achieve simplicity. There are two types of symmetry, repetition and recursion. Recursion is defining a problem in terms of itself. The reflection in a mirror of a mirror is recursive: the reflected mirror is reflecting its own image and doing so indefinitely. In math and engineering, recursion, especially, is a big win. Inductive proofs are wonderfully short.

Recursion

While you do not want to use symmetry to replace original thought, it is a powerful design principle that can create both striking and very understandable designs. As the user only has to learn a concept ones, using it in a repetitive or recursive manner becomes easy for the customer.

Good design resembles nature

By designing to resemble nature, you are capturing both what people already know and what nature may have taken centuries to perfect. As Graham writes, “[i]t’s not cheating to copy.” Using ideas from nature in your design allows you to build on proven schemes.

Good design is redesign

One key to success, not only in design but in most areas of product development and marketing, is iterate, iterate, iterate. Most books are barely readable the first time the author puts pen to paper but are the result of painstaking editing. The best games have gone through months of prototyping, user testing and feedback. It is the same with design.

Part of the iteration process is abandoning some, or most, of the earlier design. As Graham writes, “[i]t’s rare to get things right the first time. Experts expect to throw away some early work. They plan for plans to change. It takes confidence to throw work away. You have to be able to think, there’s more where that came from….Mistakes are natural. Instead of treating them as disasters, make them easy to acknowledge and easy to fix. ”

Good design can copy

Starting with a good existing design will often lead to a more beautiful design. While I did write that a key to the most innovative creators is don’t copy, that concept is not counter to beautiful design copying existing design. Creating a beautiful design is not about creating an innovative design; it is about creating a product that beautifully solves the right problem. Thus, if you base your design on something that has already approached solving the problem, it frees you up to solve it even better.

If the beauty of your design is about how to solve the problem, then you have a responsibility to incorporate existing best practices. Graham writes, “I think the greatest masters go on to achieve a kind of selflessness. They just want to get the right answer, and if part of the right answer has already been discovered by someone else, that’s no reason not to use it. They’re confident enough to take from anyone without feeling that their own vision will be lost in the process.”

Good design happens in chunks

Beautiful design does not have to come from just one designer. A team or group of designers can sometimes create a better design than just one brilliant designer. While Jony Ive is often credited with Apple’s design success, the key to Apple’s successes was creating an Industrial Design Group, under Ive, with some of the best designers in the world. They would collaborate on projects, often focusing on different elements, in creating products that captured the world’s attention and hearts.

Good design is often daring

The most successful designs and new products are ones that required the champion to be daring. Apple would not have created the iPhone or iPad if they wanted a safe solution, they would have just improved on existing devices. Amazon would not have created a billion dollar business if they had tried to create a better bookstore. Graham writes, “at every period of history, people have believed things that were just ridiculous, and believed them so strongly that you risked ostracism or even violence by saying otherwise…. Today’s experimental error is tomorrow’s new theory. If you want to discover great new things, then instead of turning a blind eye to the places where conventional wisdom and truth don’t quite meet, you should pay particular attention to them.”

daring design

Using these principles in creating games

Design is critical to creating great products. To have long-term success and build a competitive position, you are going to need beautiful products that reflect great taste, not simply a lot of data and optimization. Creating beauty, however, is not easy. If you follow the steps above, however, you improve your chances of creating the next hit product.

Key takeaways

  • While many game and tech companies focus on data and testing to create product, the key to building a game-changing product is beautiful design (see Apple) that represent great taste.
  • At the core of creating a beautiful product is simplicity and timeliness, rather than focusing on making something pretty focus on solving the user’s true problem.
  • Another key to creating beautiful products is understanding it will not be easy, great design is very difficult and requires painstaking work and iteration.

Share this:

  • Click to share on Facebook (Opens in new window) Facebook
  • Click to share on LinkedIn (Opens in new window) LinkedIn
Like Loading...
Unknown's avatarAuthor Lloyd MelnickPosted on May 20, 2020April 25, 2020Categories General Social Games Business, General Tech Business, Social CasinoTags Design process, game design, Product designLeave a comment on Taste, why creating a beautiful product is a key to success

Understanding the decoy effect

Understanding the decoy effect

Mastering consumer behavior, and your own decision making progress, is an invaluable skill and the decoy effect has an important impact on both consumer behavior and your own decisions. A post, The decoy effect: How you are influenced to choose without really knowing it on the Conversation blog, written by Gary Mortimer, deconstructs the decoy effect into its key elements. The decoy effect is primarily used in product pricing, with companies using it to drive users to a more expensive or profitable alternative.

A restaurant example helps illustrate the decoy effect. The restaurant may offer two dishes. One is a hamburger, side and drink for $5. The second is a double burger, two sides and large drink for $10. You would mentally make some calculation of their relative value but it is not clear that the more expensive option is a better value. You would decide if doubling everything worth it?

Using the decoy effect, the restaurant might offer those two options but add a third one, a double burger, one side and a regular drink for $9. For $4 more than the $5 option, you are getting a bigger burger. But for just one dollar more, you get the bigger burger plus an extra side and a larger drink. Thus the $10 option looks like an incredible bargain. In reality, it is no better a bargain than the $5 meal when you had two options, but now because of the decoy effect most people would select the $10 meal.

Asymmetric dominance effect

Customers change their preference between two options when a third option is presented, a phenomenon called asymmetric dominance. This effect suggests a decoy is priced to make one of the other options much more attractive. The decoy option is dominated in terms of perceived value (quantity, quality, extra features and so on). Companies do not price the decoy to generate sales but to nudge customers towards the target selection.

In the blog post, the author discusses the first time academics identified and showed through experimentation the decoy effect. “These findings were, in marketing terms, revolutionary. They challenged established doctrines – known as the “similarity heuristic” and the “regularity condition” – that a new product will take away market share from an existing product and cannot increase the probability of a customer choosing the original product.”

Choice overload

The decoy effect is enabled by another phenomenon, choice overload. As customers face many options, the further options increase anxiety and hinder decision-making. Customers then adapt by reducing the number of criteria they use for choosing, maybe using price and volume to decide on the best value. Mortimer writes, “through manipulating these key choice attributes, a decoy steers you in a particular direction while giving you the feeling you are making a rational, informed choice.”

Using the decoy effect for good

While the decoy effect can be abused to drive consumers to over-priced options, it can also be used to highlight the value of an option that is in both the provider’s and customer’s best interest. Mortimer quotes research by Dan Ariely that looked at three subscription offers from the Economist, which he replicated for the Australian newspaper:
Decoy Effect

In this scenario, customers could receive either a digital version of the newspaper, a digital version plus the weekend edition or digital plus the printed version. The cost of digital only was the same as digital plus weekend. In this case, the decoy effect highlights the value of the mid-price option rather than driving customers to the most expensive option.

Conclusion

The decoy effect is a powerful tool in driving consumer decisions. When you are deciding between options, rather than look at the relative value of each option directly compared with the others, understand the value to you and make the optimal choice for yourself. When creating options for your customers, consider using the decoy effect to highlight the benefits of options that your customers are more likely to prefer rather than tricking them into the wrong purchase.

Key takeaways

  • The decoy effect is used when pricing products, adding a third option that drives customers to the most expensive or profitable option
  • A phenomenon called asymmetric dominance causes customers to change their preference between two options when a third option is presented.
  • The decoy effect is enabled by another phenomenon, choice overload, as customers who face many options will adapt by reducing the number of criteria they use for choosing.

Share this:

  • Click to share on Facebook (Opens in new window) Facebook
  • Click to share on LinkedIn (Opens in new window) LinkedIn
Like Loading...
Unknown's avatarAuthor Lloyd MelnickPosted on May 13, 2020April 25, 2020Categories behavioral economics, General Social Games Business, General Tech Business, Social Games MarketingTags behavioral economics, Decoy Effect3 Comments on Understanding the decoy effect

Posts pagination

Previous page Page 1 Page 2 Page 3 Page 4 … Page 46 Next page

Get my book on LTV

The definitive book on customer lifetime value, Understanding the Predictable, is now available in both print and Kindle formats on Amazon.

Understanding the Predictable delves into the world of Customer Lifetime Value (LTV), a metric that shows how much each customer is worth to your business. By understanding this metric, you can predict how changes to your product will impact the value of each customer. You will also learn how to apply this simple yet powerful method of predictive analytics to optimize your marketing and user acquisition.

For more information, click here

Follow The Business of Social Games and Casino on WordPress.com

Enter your email address to follow this blog and receive notifications of new posts by email.

Join 791 other subscribers

Most Recent Posts

  • Join me at PDMA Inspire for my talk on new product prioritization
  • Why keep studying?
  • The next three years of this blog
  • Interview with the CEO of Murka on the biggest growth opportunity in gaming, Barak David

Lloyd Melnick

This is Lloyd Melnick’s personal blog.  All views and opinions expressed on this website are mine alone and do not represent those of people, institutions or organizations that I may or may not be associated with in professional or personal capacity.

I am a serial builder of businesses (senior leadership on three exits worth over $700 million), successful in big (Disney, Stars Group/PokerStars, Zynga) and small companies (Merscom, Spooky Cool Labs) with over 20 years experience in the gaming and casino space.  Currently, I am the GM of VGW’s Chumba Casino and on the Board of Directors of Murka Games and Luckbox.

Topic Areas

  • Analytics (114)
  • Bayes' Theorem (8)
  • behavioral economics (8)
  • blue ocean strategy (14)
  • Crowdfunding (4)
  • DBA (2)
  • General Social Games Business (459)
  • General Tech Business (195)
  • Growth (88)
  • International Issues with Social Games (50)
  • Lloyd's favorite posts (101)
  • LTV (54)
  • Machine Learning (10)
  • Metaverse (1)
  • Mobile Platforms (37)
  • Prioritization (1)
  • Social Casino (52)
  • Social Games Marketing (105)
  • thinking fast and slow (5)
  • Uncategorized (33)

Social

  • View CasualGame’s profile on Facebook
  • View @lloydmelnick’s profile on Twitter
  • View lloydmelnick’s profile on LinkedIn

RSS

RSS Feed RSS - Posts

RSS Feed RSS - Comments

Categories

  • Analytics (114)
  • Bayes' Theorem (8)
  • behavioral economics (8)
  • blue ocean strategy (14)
  • Crowdfunding (4)
  • DBA (2)
  • General Social Games Business (459)
  • General Tech Business (195)
  • Growth (88)
  • International Issues with Social Games (50)
  • Lloyd's favorite posts (101)
  • LTV (54)
  • Machine Learning (10)
  • Metaverse (1)
  • Mobile Platforms (37)
  • Prioritization (1)
  • Social Casino (52)
  • Social Games Marketing (105)
  • thinking fast and slow (5)
  • Uncategorized (33)

Archives

  • September 2023
  • December 2021
  • July 2021
  • March 2021
  • February 2021
  • January 2021
  • December 2020
  • November 2020
  • October 2020
  • September 2020
  • August 2020
  • July 2020
  • June 2020
  • May 2020
  • April 2020
  • March 2020
  • February 2020
  • January 2020
  • November 2019
  • October 2019
  • September 2019
  • June 2019
  • May 2019
  • April 2019
  • March 2019
  • February 2019
  • January 2019
  • December 2018
  • June 2018
  • May 2018
  • April 2018
  • March 2018
  • February 2018
  • January 2018
  • December 2017
  • June 2017
  • May 2017
  • April 2017
  • March 2017
  • February 2017
  • January 2017
  • December 2016
  • November 2016
  • October 2016
  • September 2016
  • June 2016
  • May 2016
  • April 2016
  • March 2016
  • February 2016
  • January 2016
  • December 2015
  • November 2015
  • October 2015
  • September 2015
  • July 2015
  • June 2015
  • May 2015
  • April 2015
  • March 2015
  • February 2015
  • January 2015
  • December 2014
  • November 2014
  • October 2014
  • September 2014
  • August 2014
  • July 2014
  • June 2014
  • May 2014
  • April 2014
  • March 2014
  • February 2014
  • January 2014
  • December 2013
  • November 2013
  • October 2013
  • September 2013
  • August 2013
  • July 2013
  • June 2013
  • May 2013
  • April 2013
  • March 2013
  • February 2013
  • January 2013
  • December 2012
  • November 2012
  • October 2012
  • September 2012
  • August 2012
  • July 2012
  • June 2012
  • May 2012
  • April 2012
  • March 2012
  • February 2012
  • January 2012
  • December 2011
  • November 2011
  • October 2011
  • September 2011
  • August 2011
  • July 2011
  • June 2011
  • May 2011
  • December 2010
January 2026
S M T W T F S
 123
45678910
11121314151617
18192021222324
25262728293031
« Sep    

by Lloyd Melnick

All posts by Lloyd Melnick unless specified otherwise
Google+

Enter your email address to subscribe to this blog and receive notifications of new posts by email.

Join 791 other subscribers
Follow Lloyd Melnick on Quora

RSS HBR Blog

  • What Actually Works to Change Someone’s Mind
  • Our Favorite Management Tips of 2025
  • How to Manage—and Motivate—Gen Z
  • The Most-Watched HBR Videos of 2025
  • The HBR Charts that Help Explain 2025
  • The Most Popular HBR Podcast Episodes of 2025
  • How the Best Leaders Develop and Spend “Innovation Capital”
  • The 10 Most Popular HBR Articles of 2025
  • How Work Changed in 2025, According to HBR Readers
  • What Leaders Can Learn from a Formula 1 Turnaround

RSS Techcrunch

  • An error has occurred; the feed is probably down. Try again later.

RSS MIT Sloan Management Review Blog

  • Calm: The Underrated Capability Every Leader Needs Now
  • The Top Five MIT SMR Videos of 2025
  • Three Steps Toward Fairer Talent Management
  • From Crisis to Coopetition: What Leaders Can Learn From Anesthesiologists
  • AI Coding Tools: The Productivity Trap Most Companies Miss
  • How Procter & Gamble Uses AI to Unlock New Insights From Data
  • Rewire Organizational Knowledge With GenAI
  • Hungry for Learning: Wendy’s Will Croushorn
  • Beat Burnout: 10 Essential MIT SMR Reads
  • How Leaders Stay True to Themselves and Their Stakeholders
The Business of Social Games and Casino Website Powered by WordPress.com.
  • Subscribe Subscribed
    • The Business of Social Games and Casino
    • Join 726 other subscribers
    • Already have a WordPress.com account? Log in now.
    • The Business of Social Games and Casino
    • Subscribe Subscribed
    • Sign up
    • Log in
    • Report this content
    • View site in Reader
    • Manage subscriptions
    • Collapse this bar
 

Loading Comments...
 

    %d